
What is
Geointeractiva?
Geointereactiva is an application designed to promote interactive learning that differs from the rote learning model. The tools enable adaptive use of the work elements under the user’s own criteria.
It is a digital tool that promotes creativity in the field of geography and cartography, as well as in other disciplines, by offering critical and creative interaction.
The map design is intended for educational use and is not a strictly technical platform. In this line, both the application menus and the map objects have been given an appealing design to encourage intuitive learning of the geography of any area in the world.
Geointeractiva is ideal for anyone who’s interested in interactive maps. We are continuously adding new tools and functions to improve the user experience.
Create
Choose a map and the layers that compose it, generate markers, graphics, polygons, statistics and much more.
Edit
Edit, import files and customize your maps by using different tools hosted in the menus.
Share
Share your maps with other users or create working groups with the Interactive Classroom or on social media.
Tools

Tools menu
Import files, organize data and control any customizable attribute of the map through this editor.
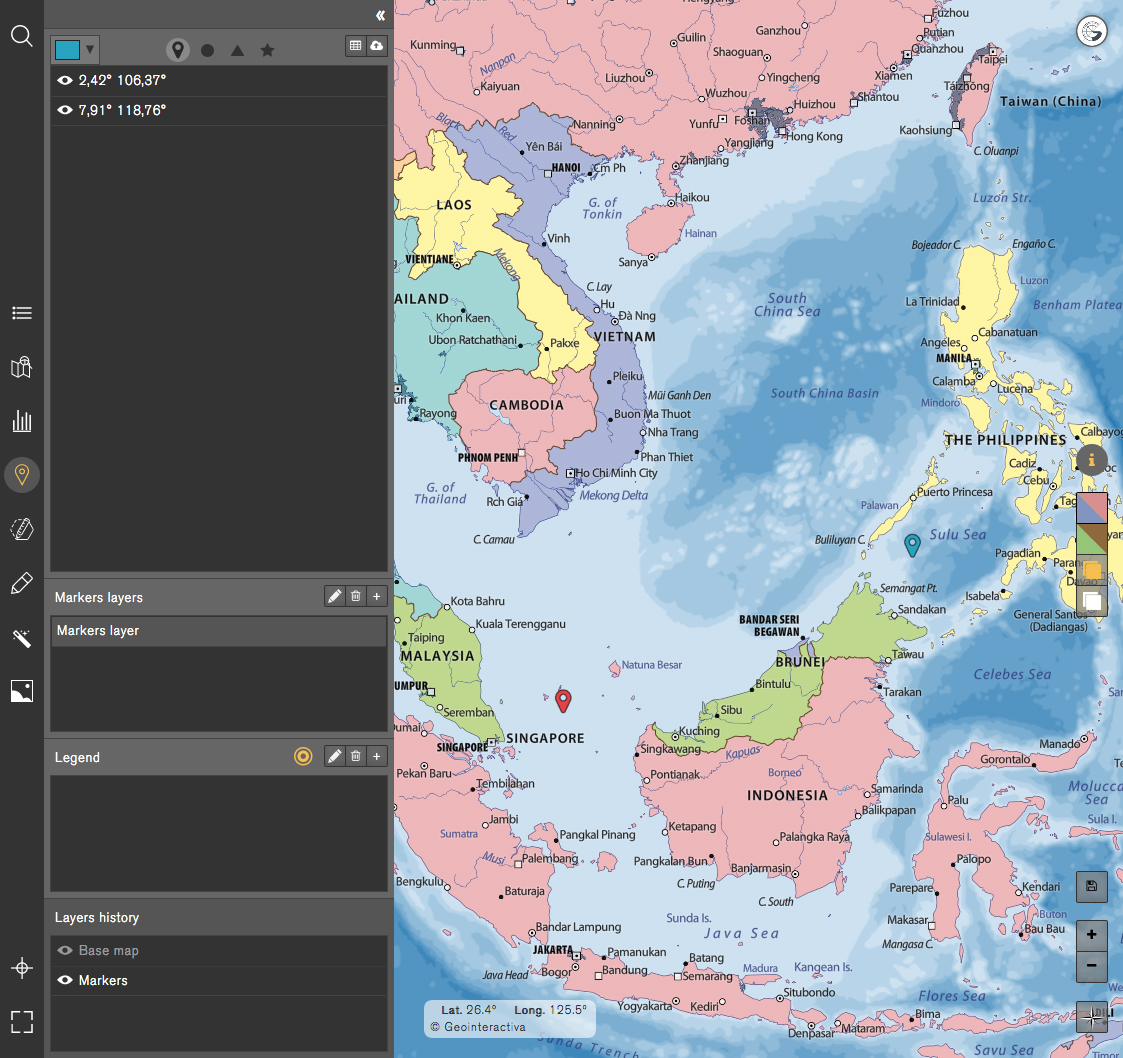

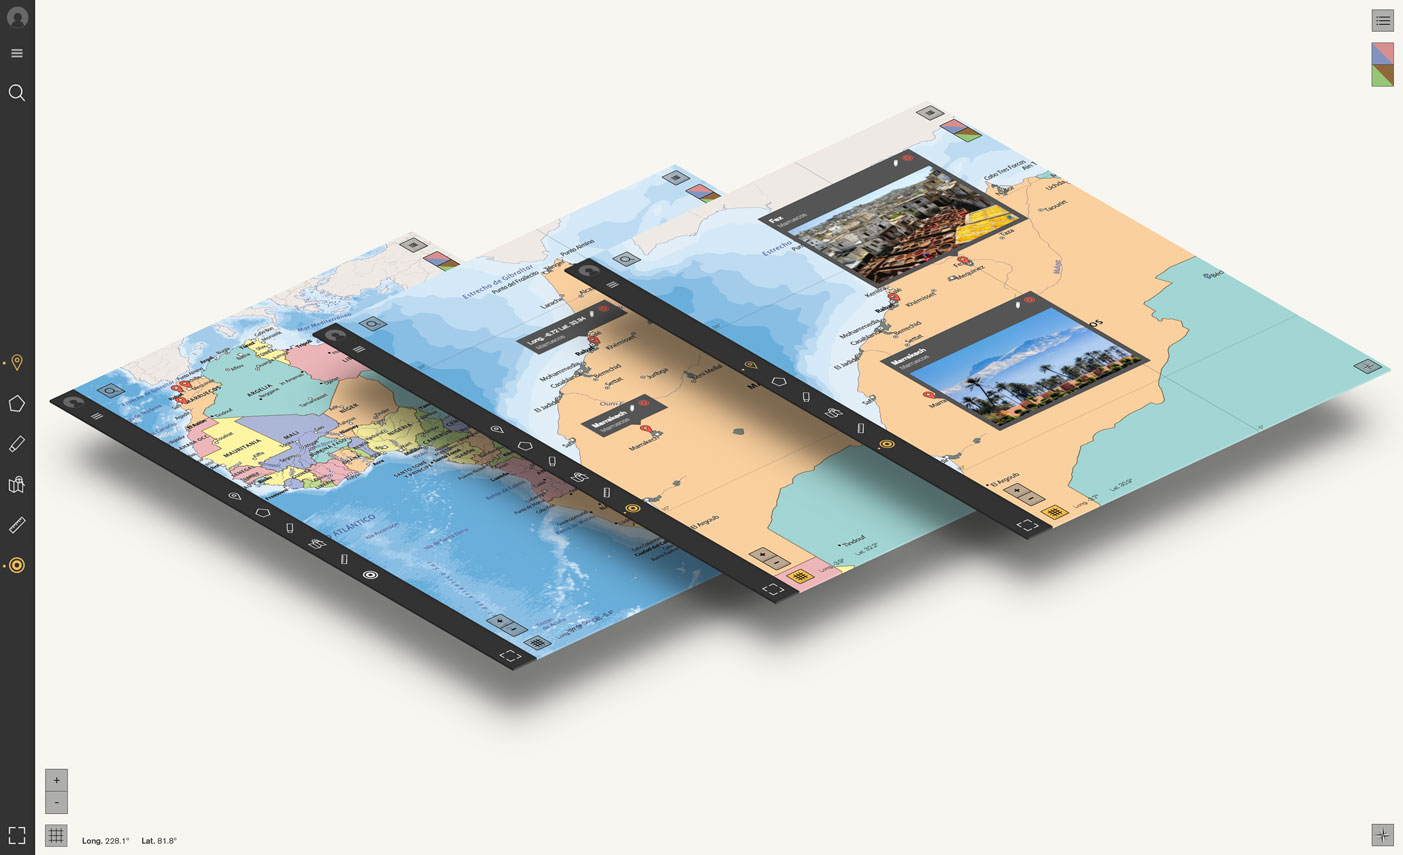
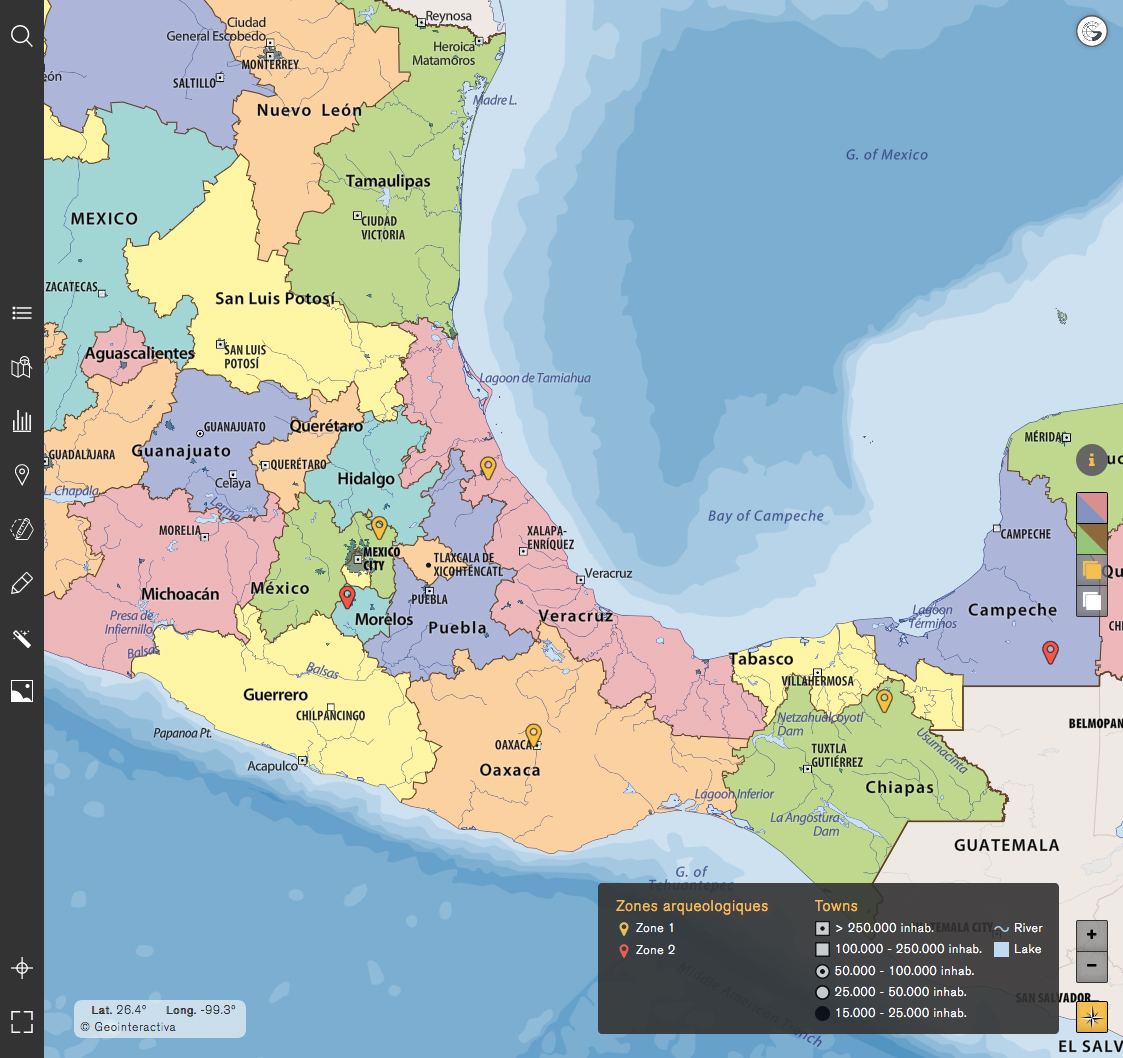
Marker
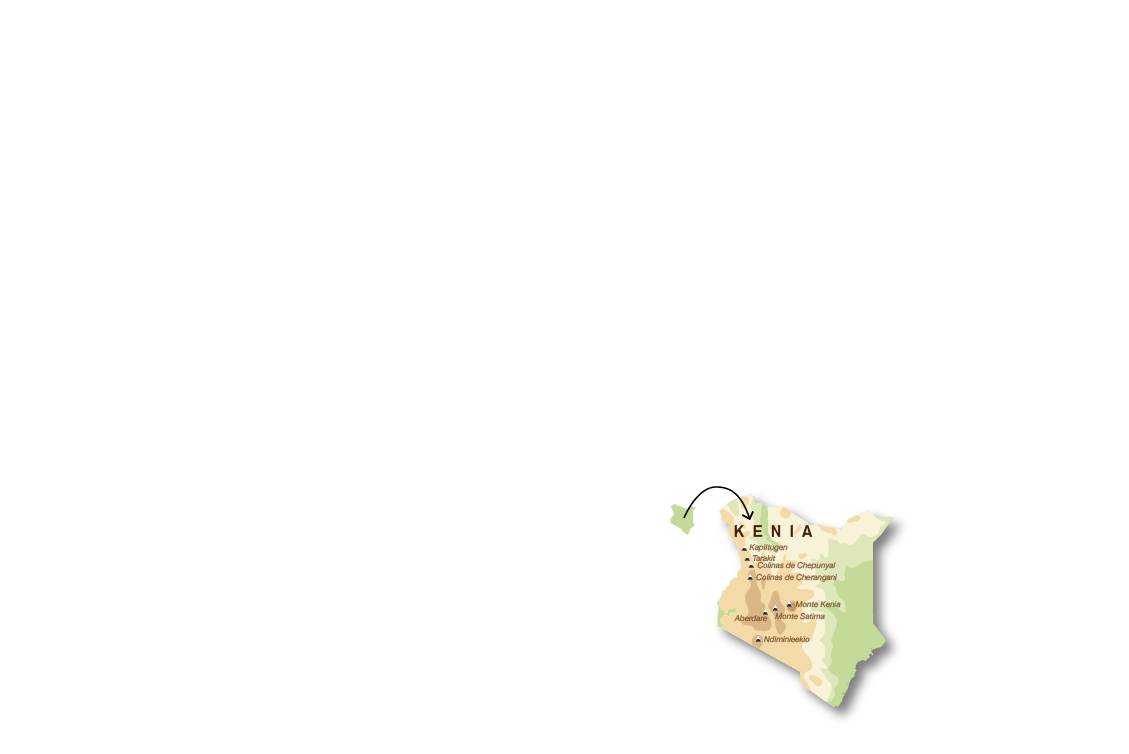
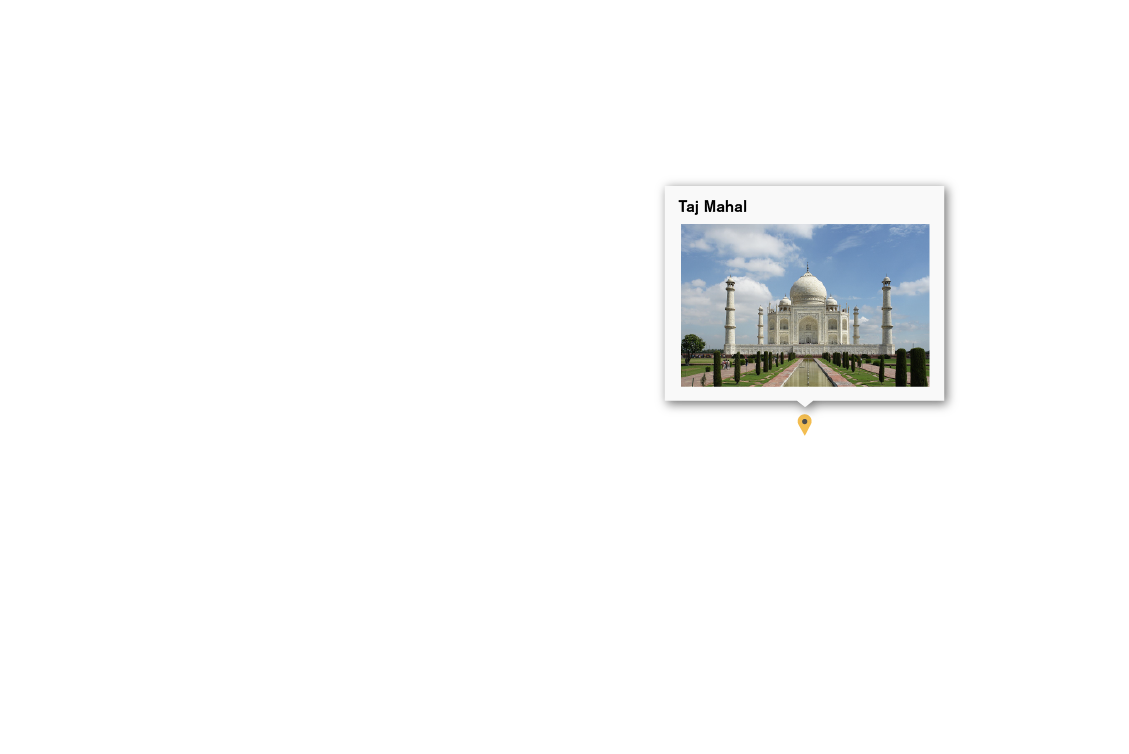
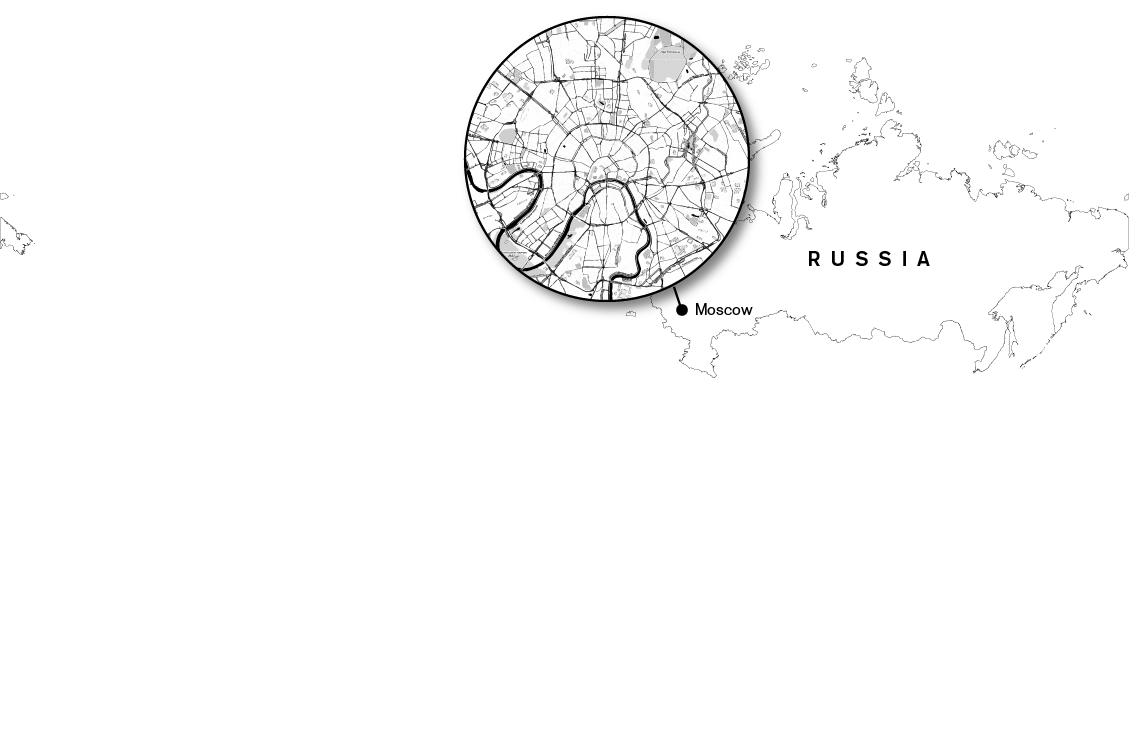
The Markers tool enables the user to place objects to georeference points on the surface of the planet on the map. It is also a graphic, audiovisual presentation tool. Markers can be edited and grouped into categories to make a presentation format.

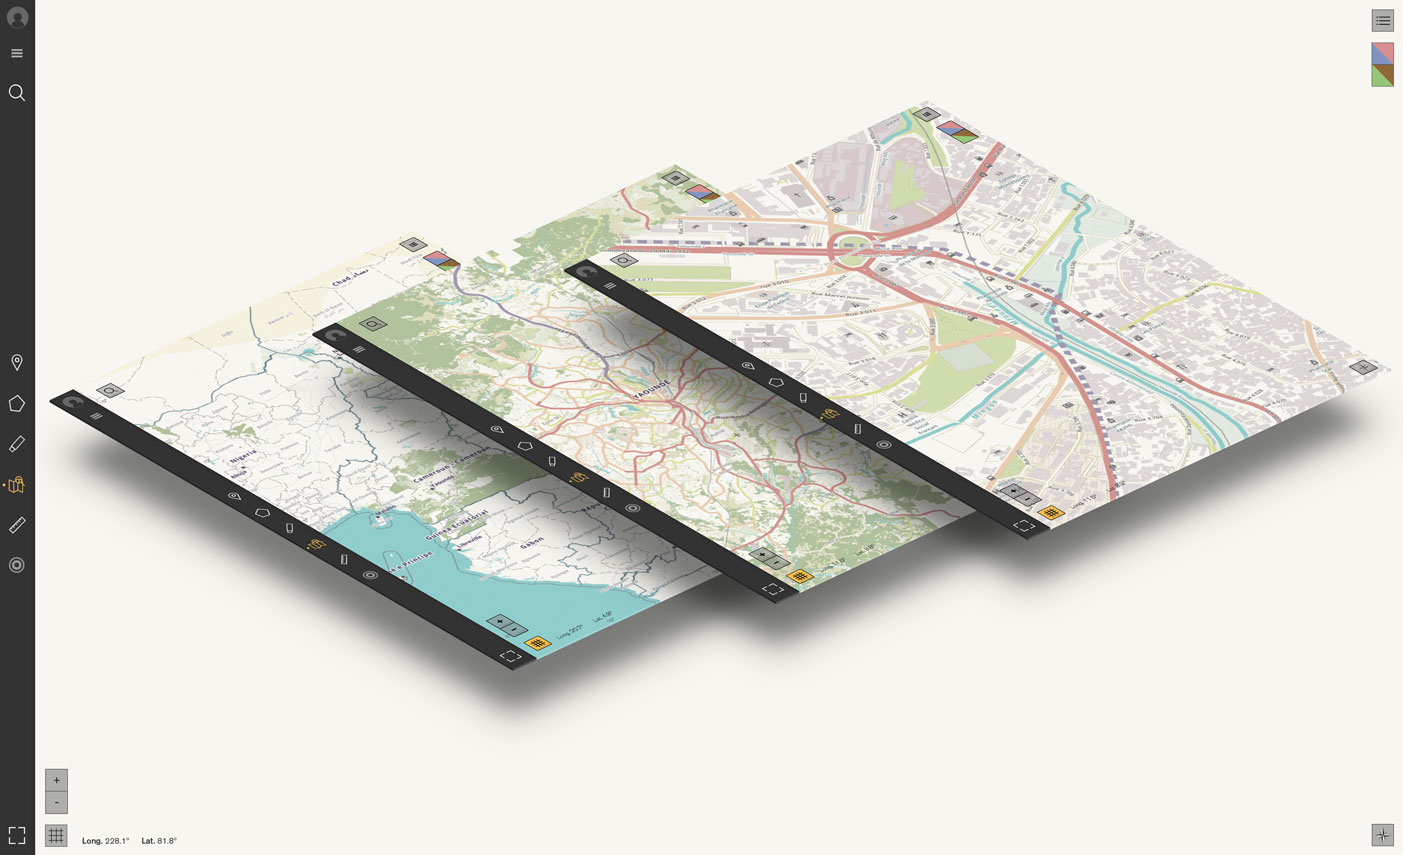
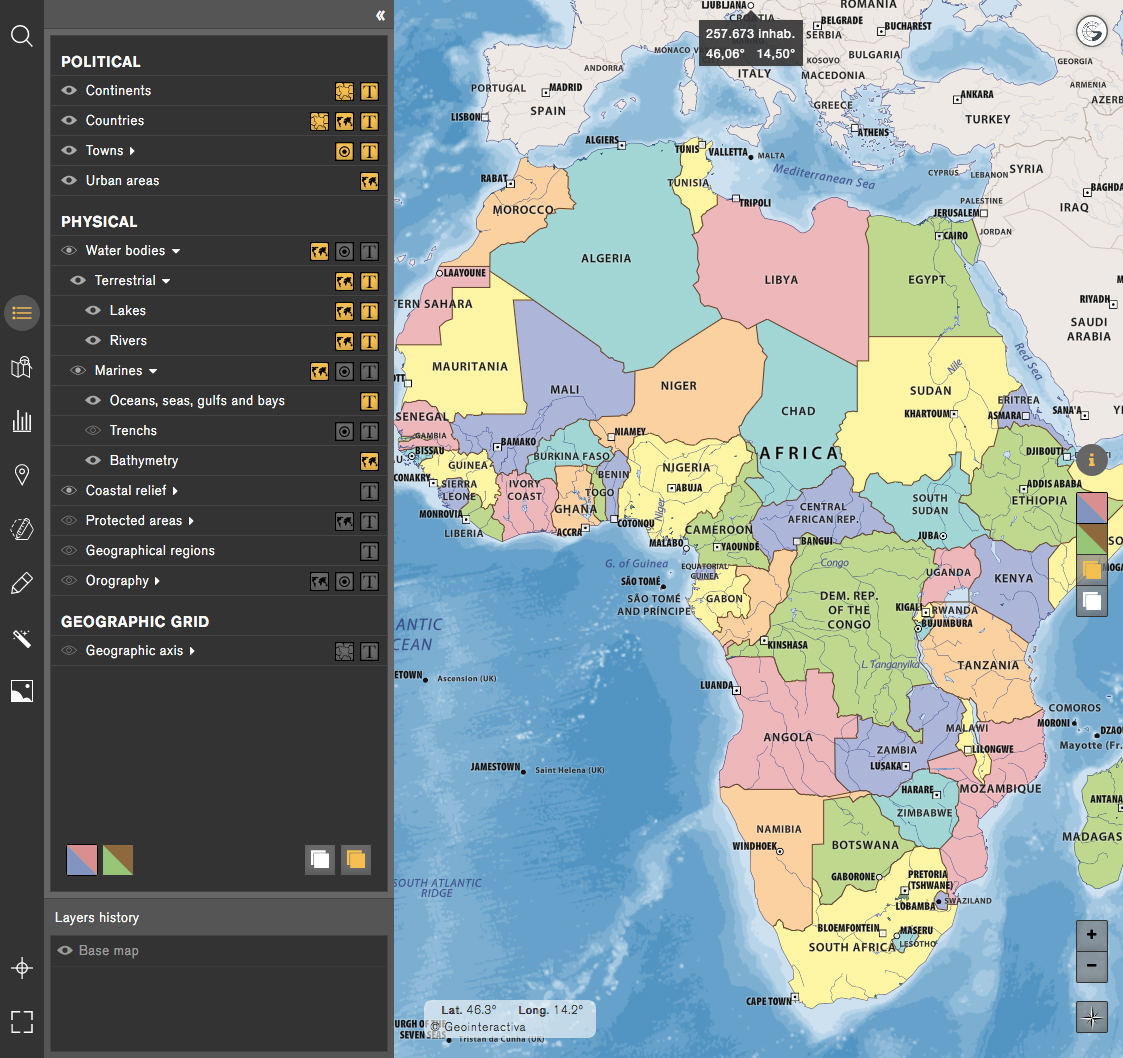
Layers menu
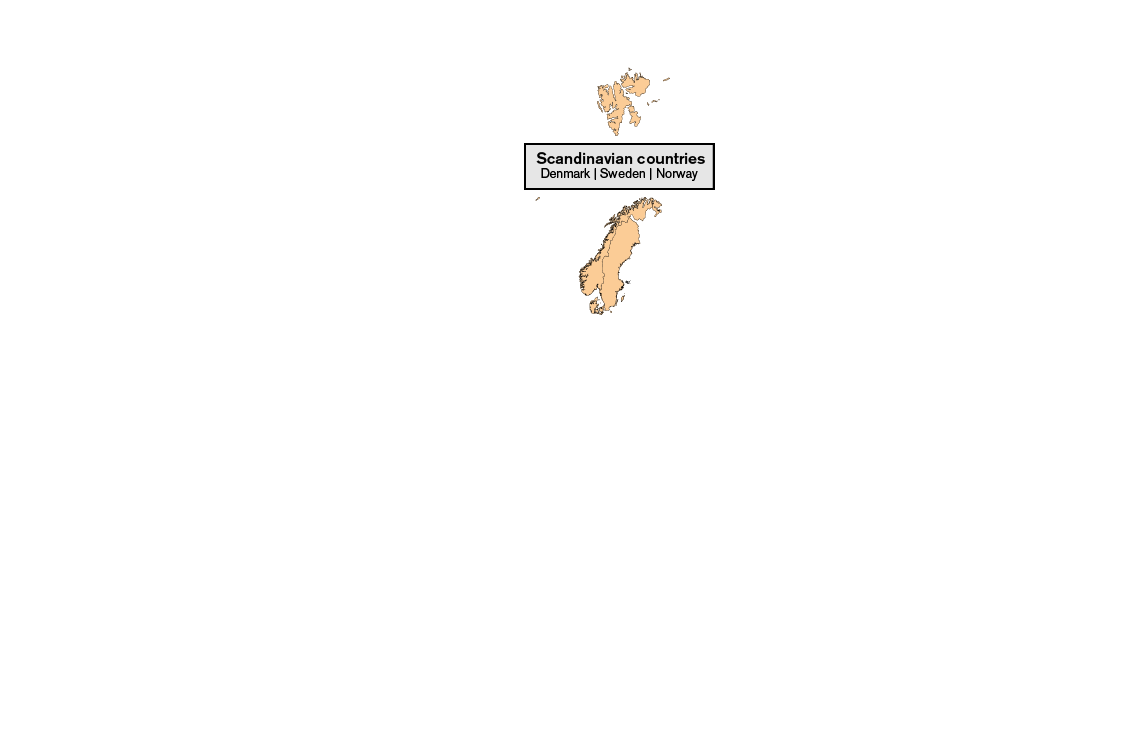
This menu allows you to create maps with unique layer combinations. The physical and political features of the map can be combined according to your needs. Each map object (e.g. capes and headlands / coastal relief) is easily distinguishable from the other map elements (image, point, text, and line).

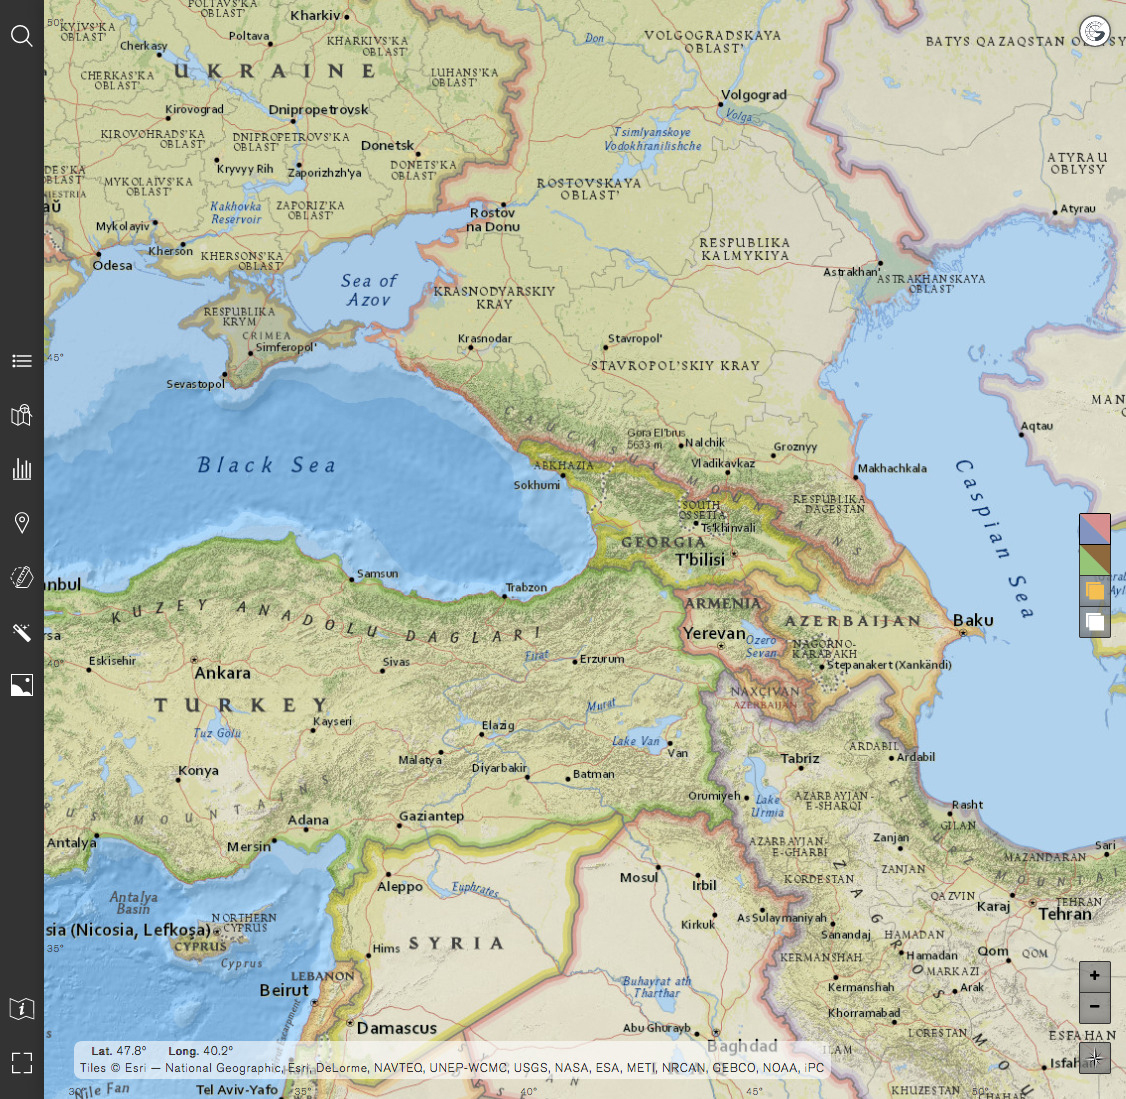
Open source maps
Allows you to import any open source map and combine it with the custom elements created by the user.

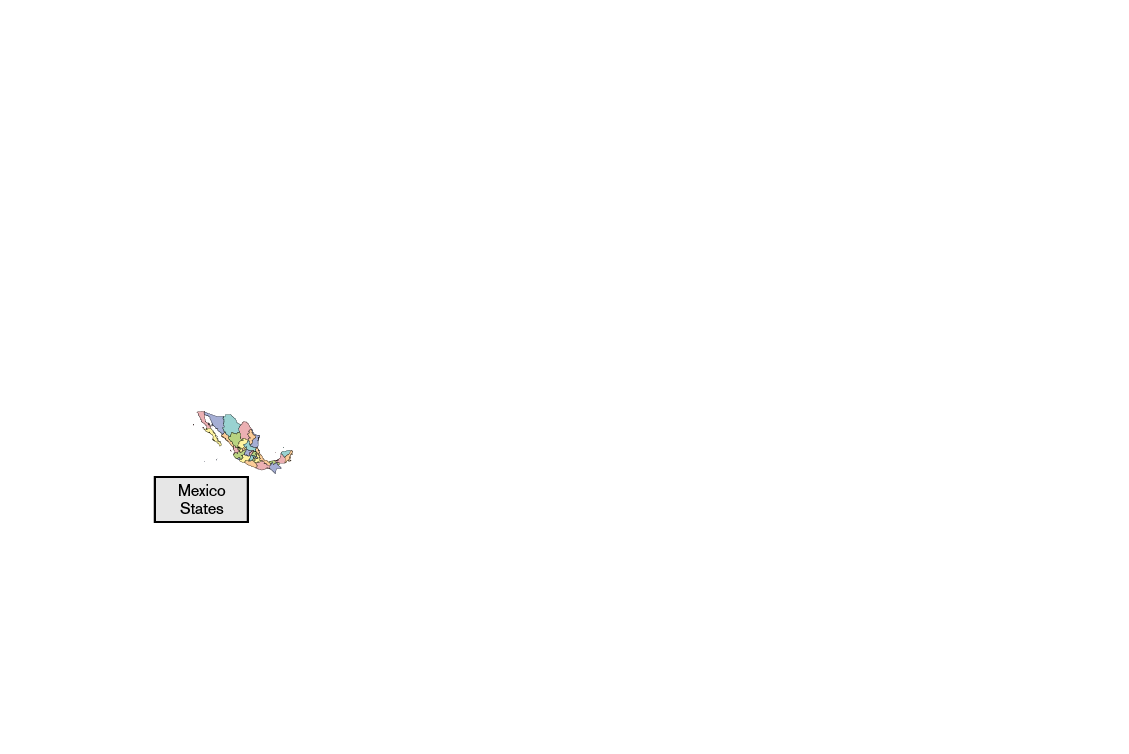
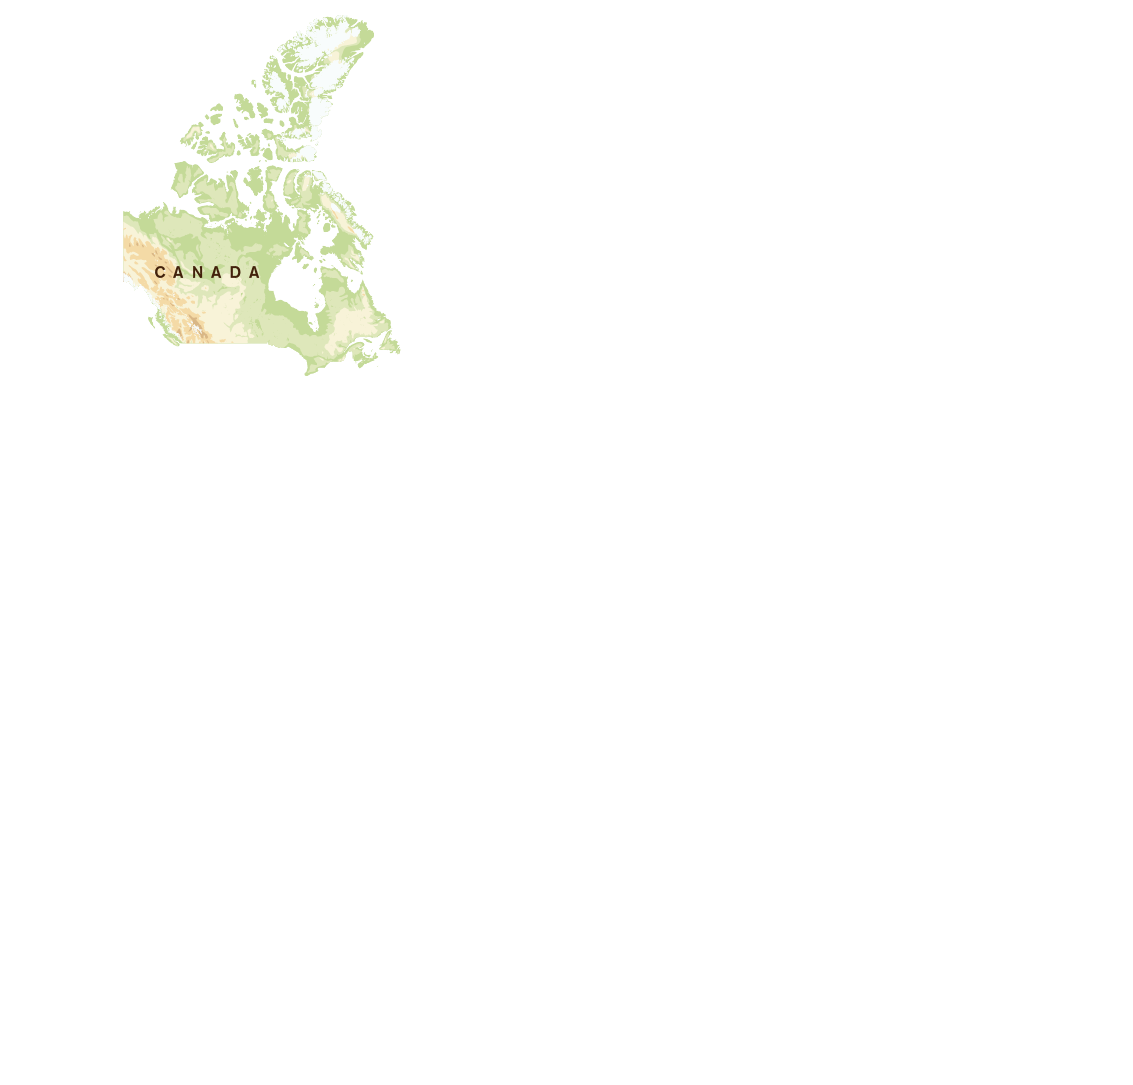
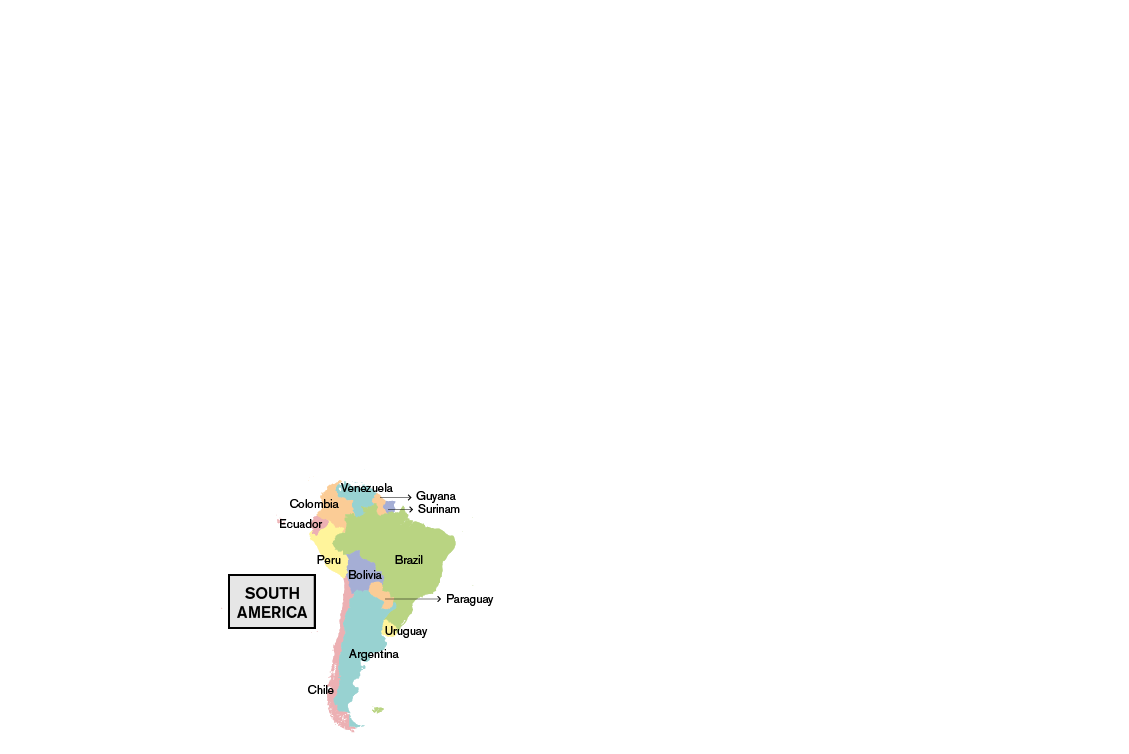
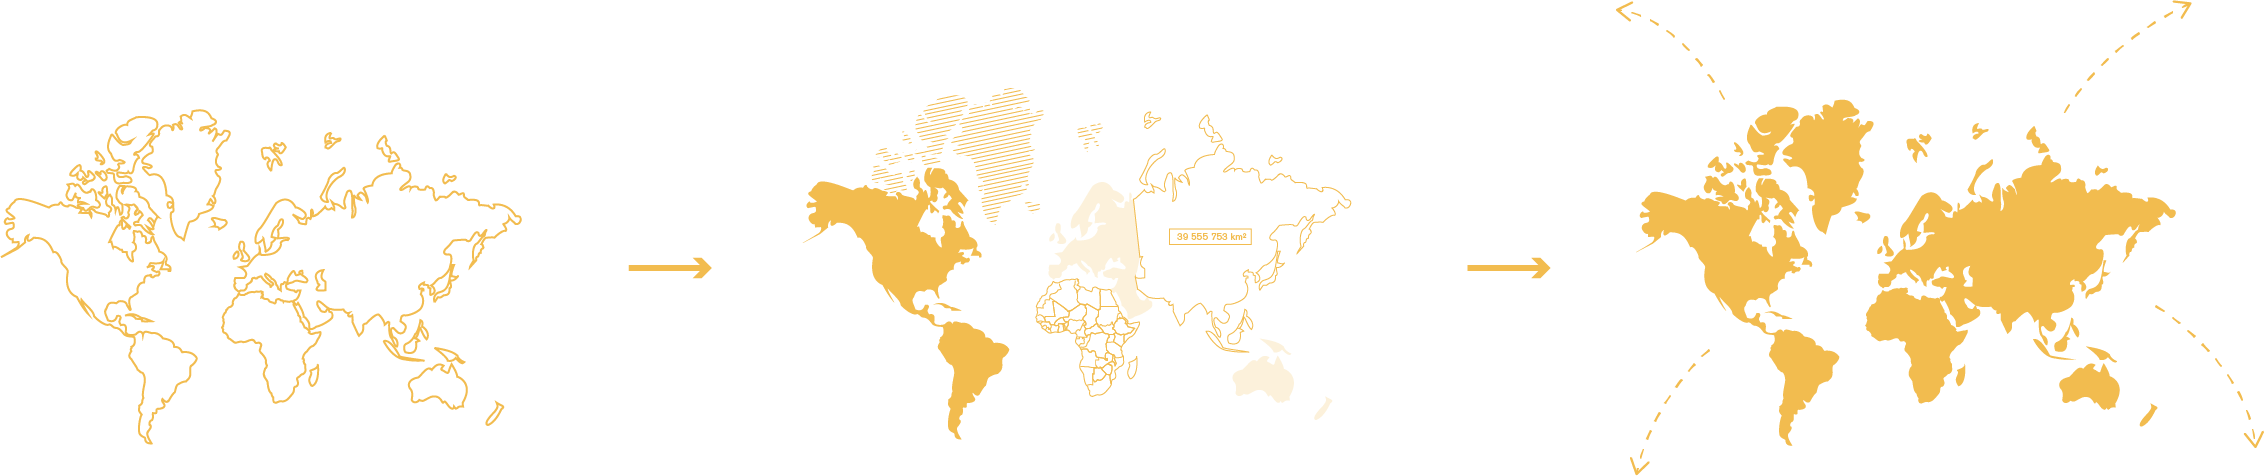
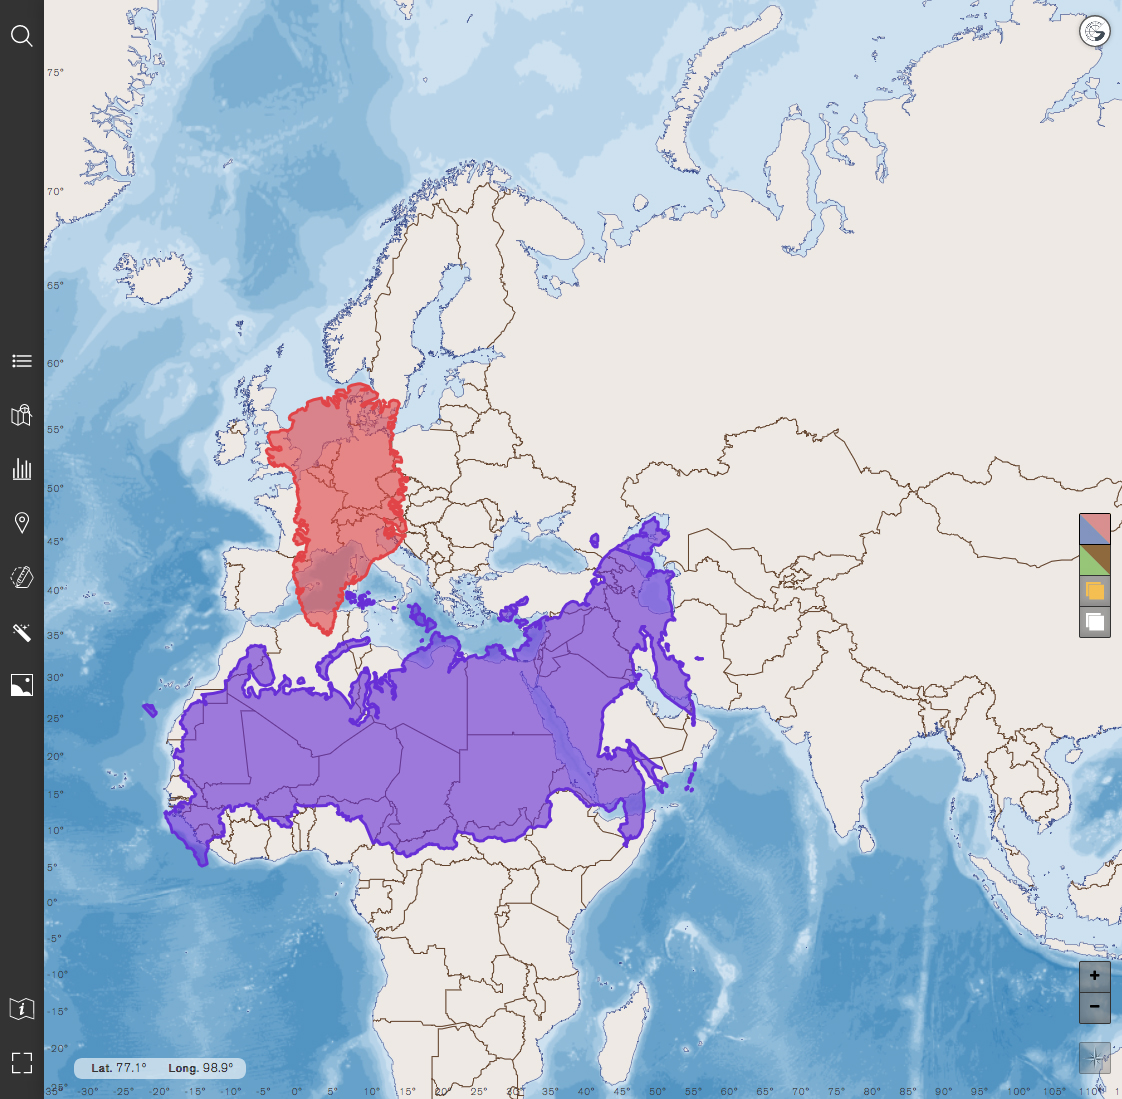
Generate regions
By activating this tool, which works similarly to the Polygon, you can compare the area and shape of two countries of distant latitudes. Drag and change their latitude to see the effects it has in the Pseudo-Mercator projection that we use on Geointeractiva maps.

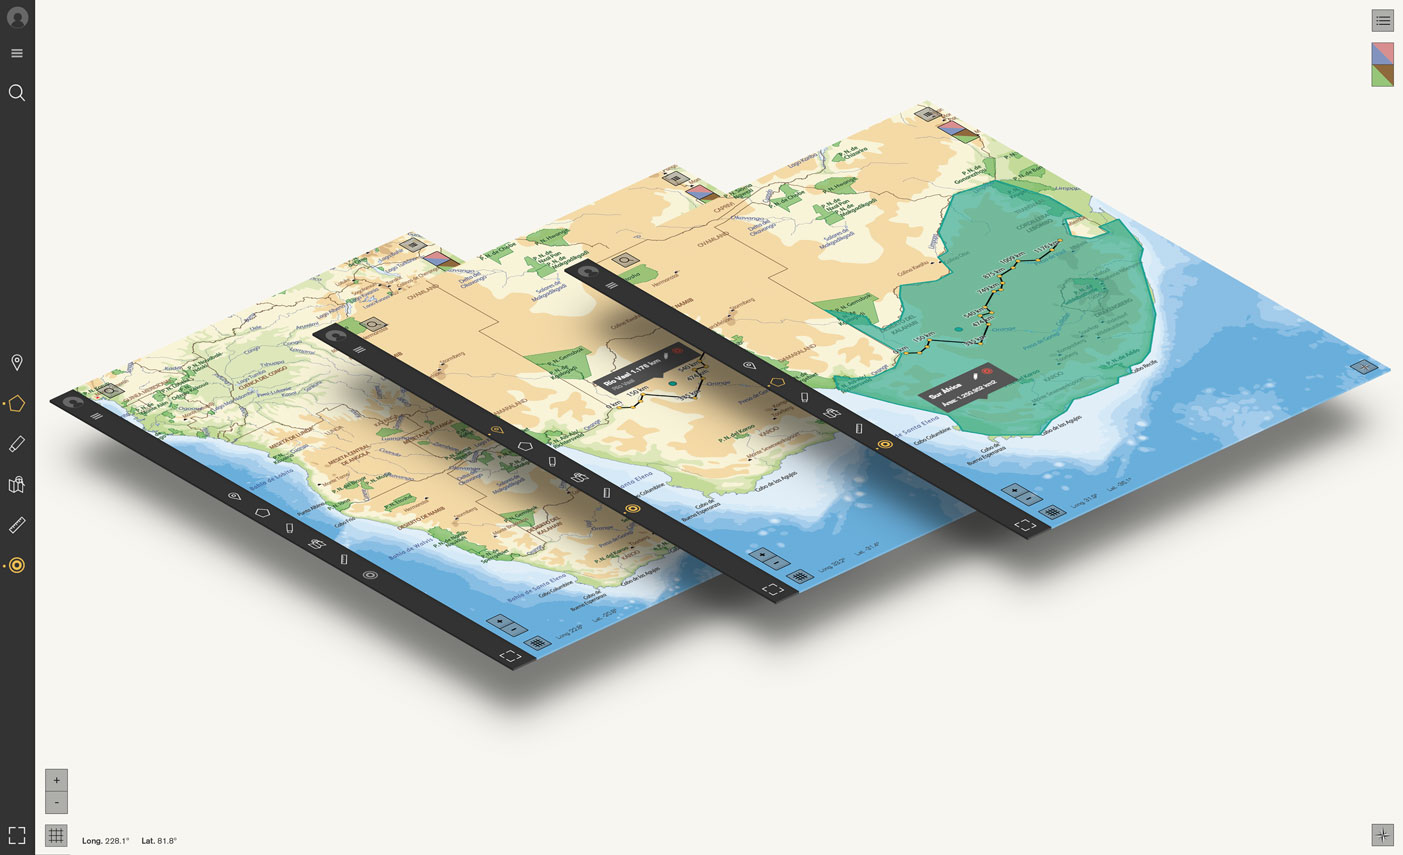
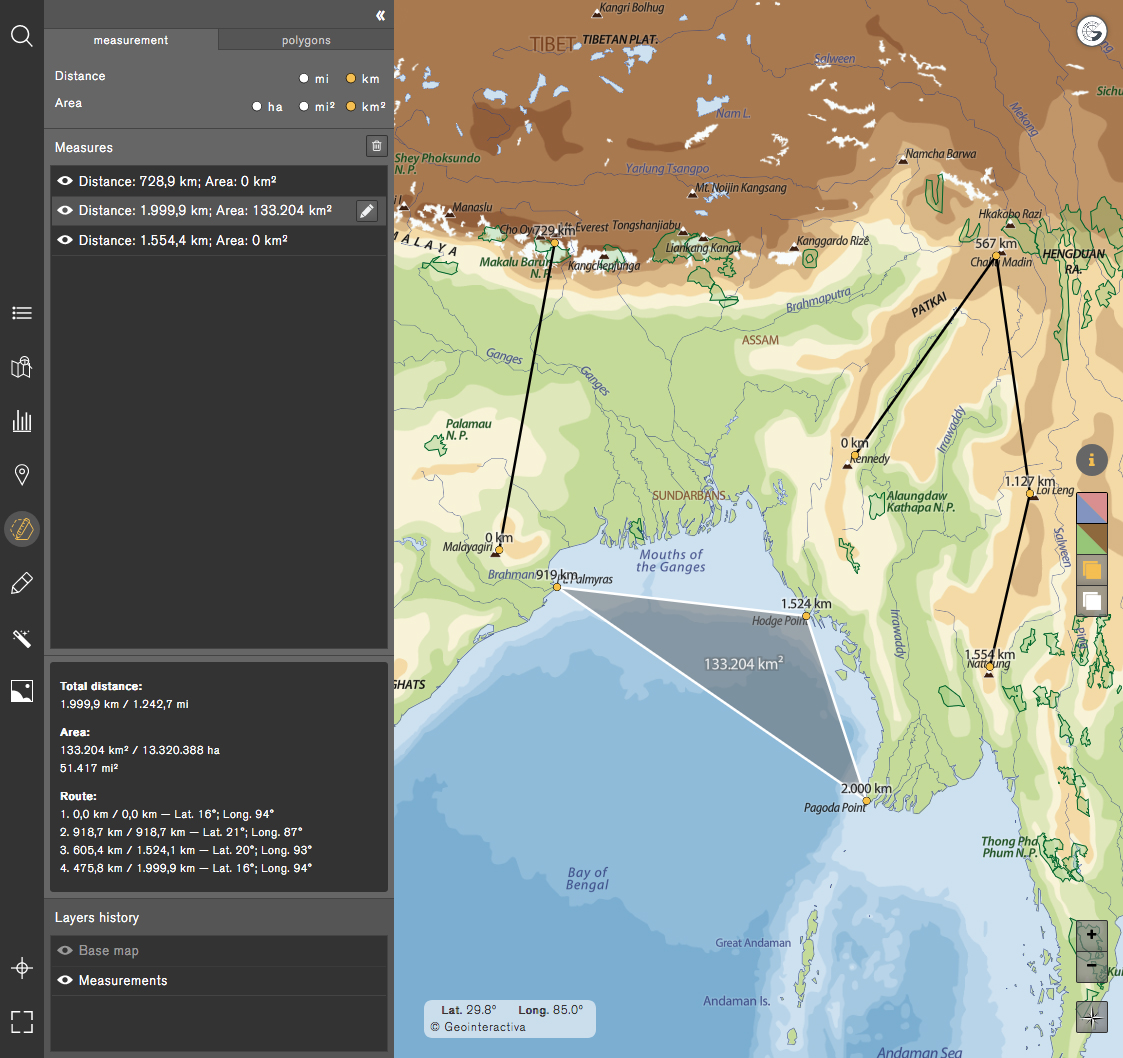
Measuring tool
This enables straight-line measuring of longitudes in kilometres or miles by setting the stages of the trip with every click of the mouse, and area calculation by linking the starting and end points of the segments created. Both measurements can be saved as objects in an interactive layer.

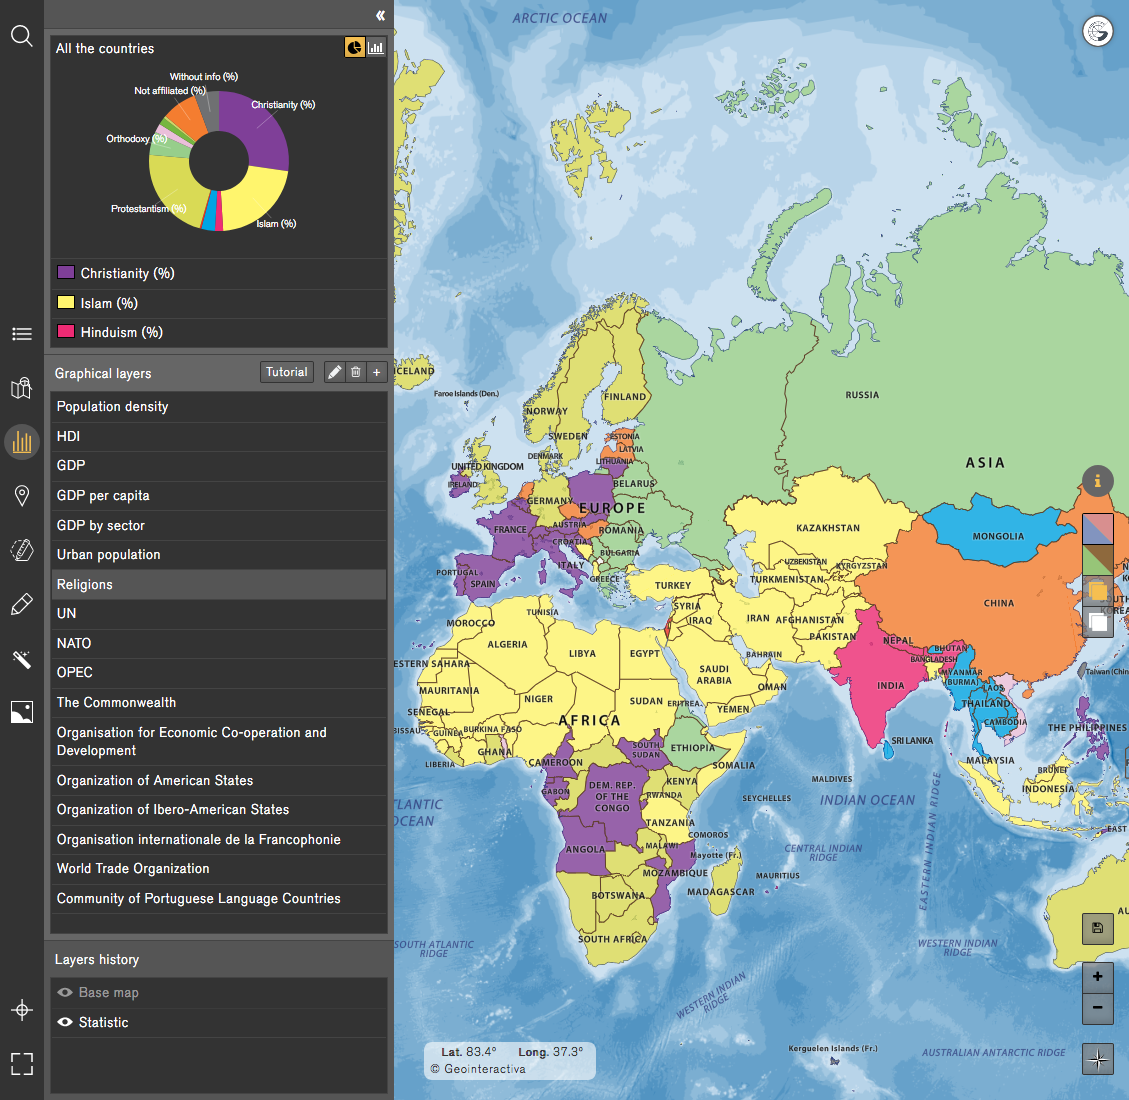
Statistics and thematics maps
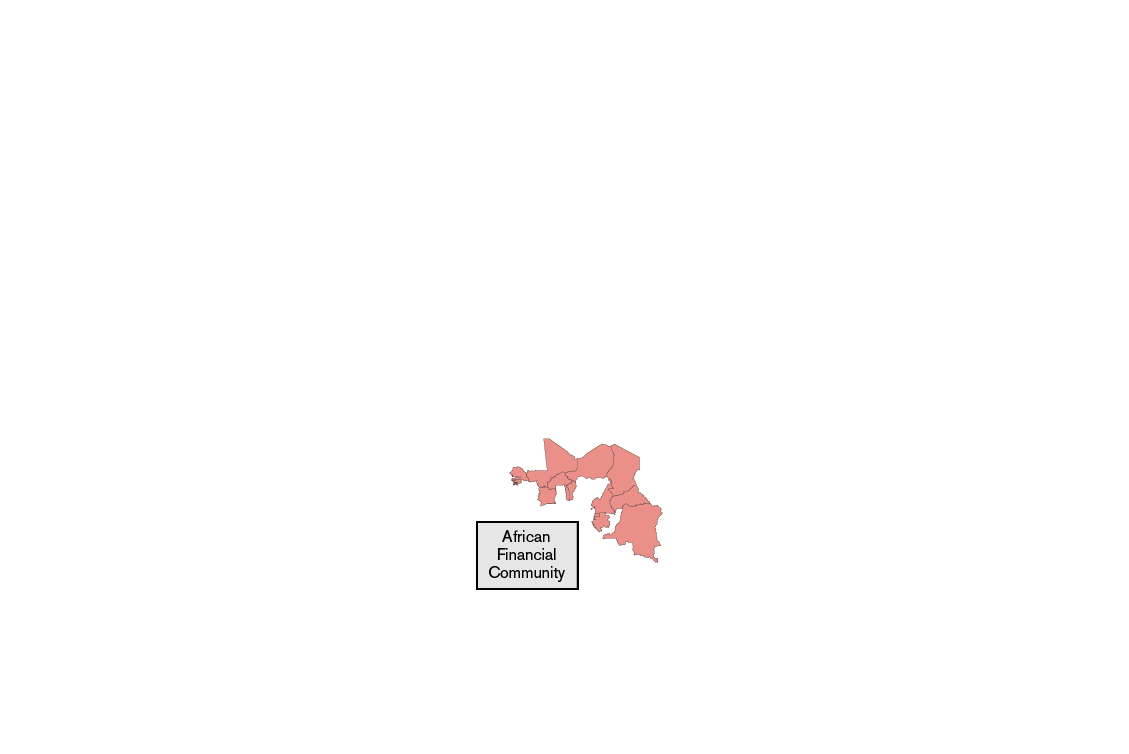
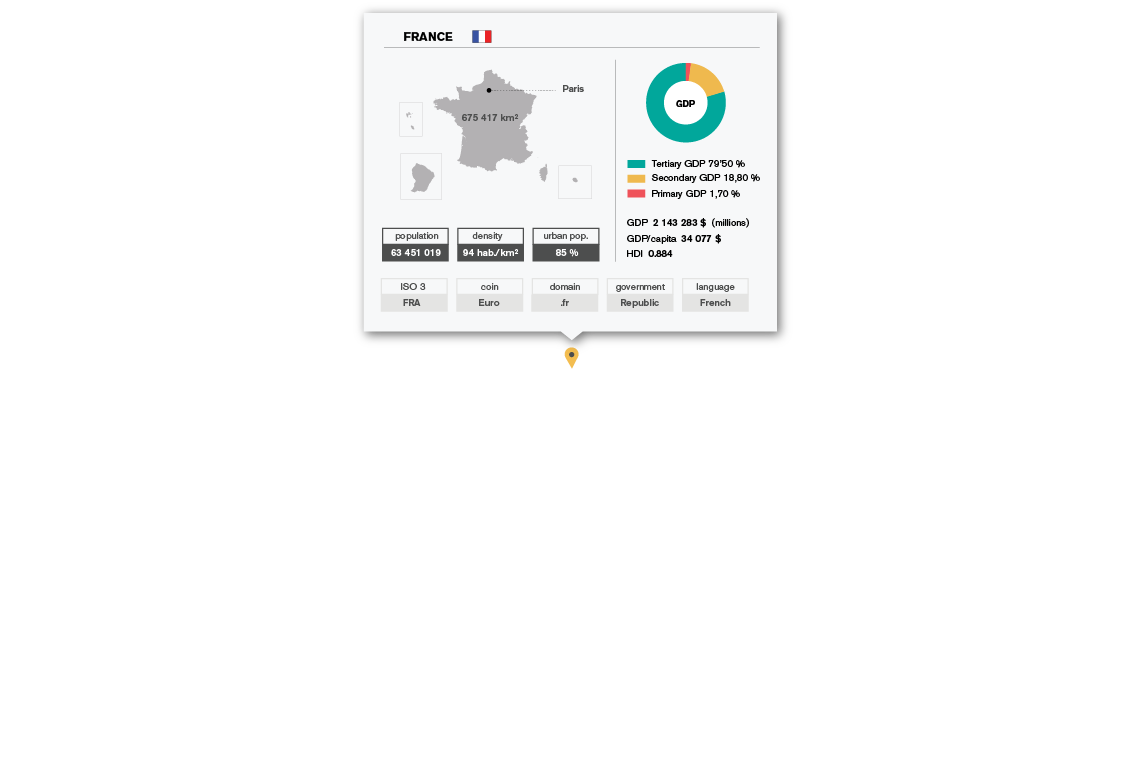
This tool allows you to generate and incorporate spreadsheets to create your own maps with numerical information (statistical maps) or alphanumeric (thematic maps) and visualize it in the form of maps in any continent, country or other administrative division.

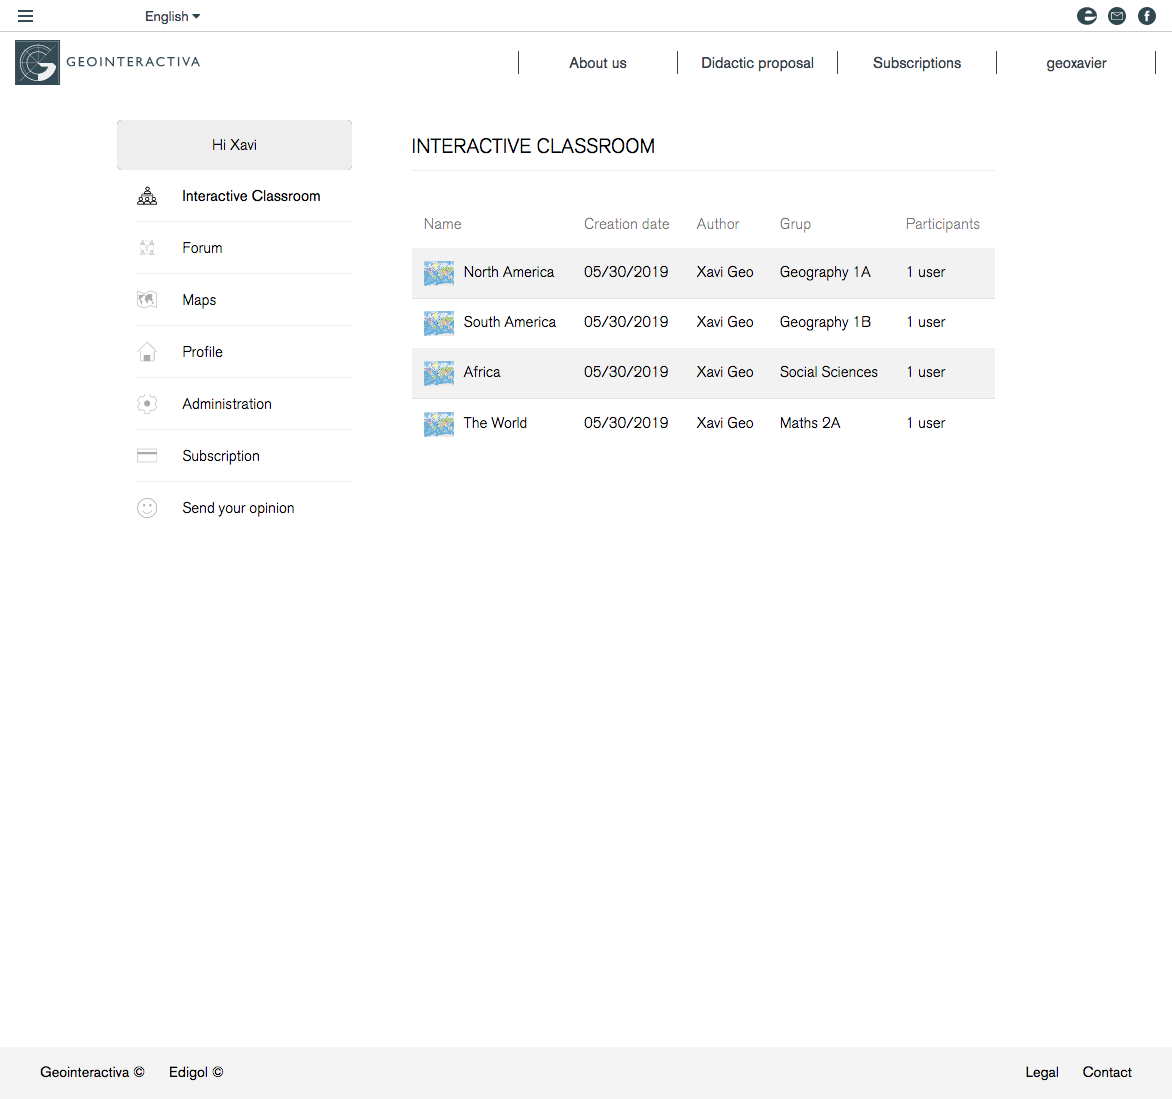
Interactive classroom
In this space exclusively for the ‘Academic’ users, users’s groups and levels of access can be generated and managed. For example, a teacher can divide a class into several groups and share a different content with each of them.

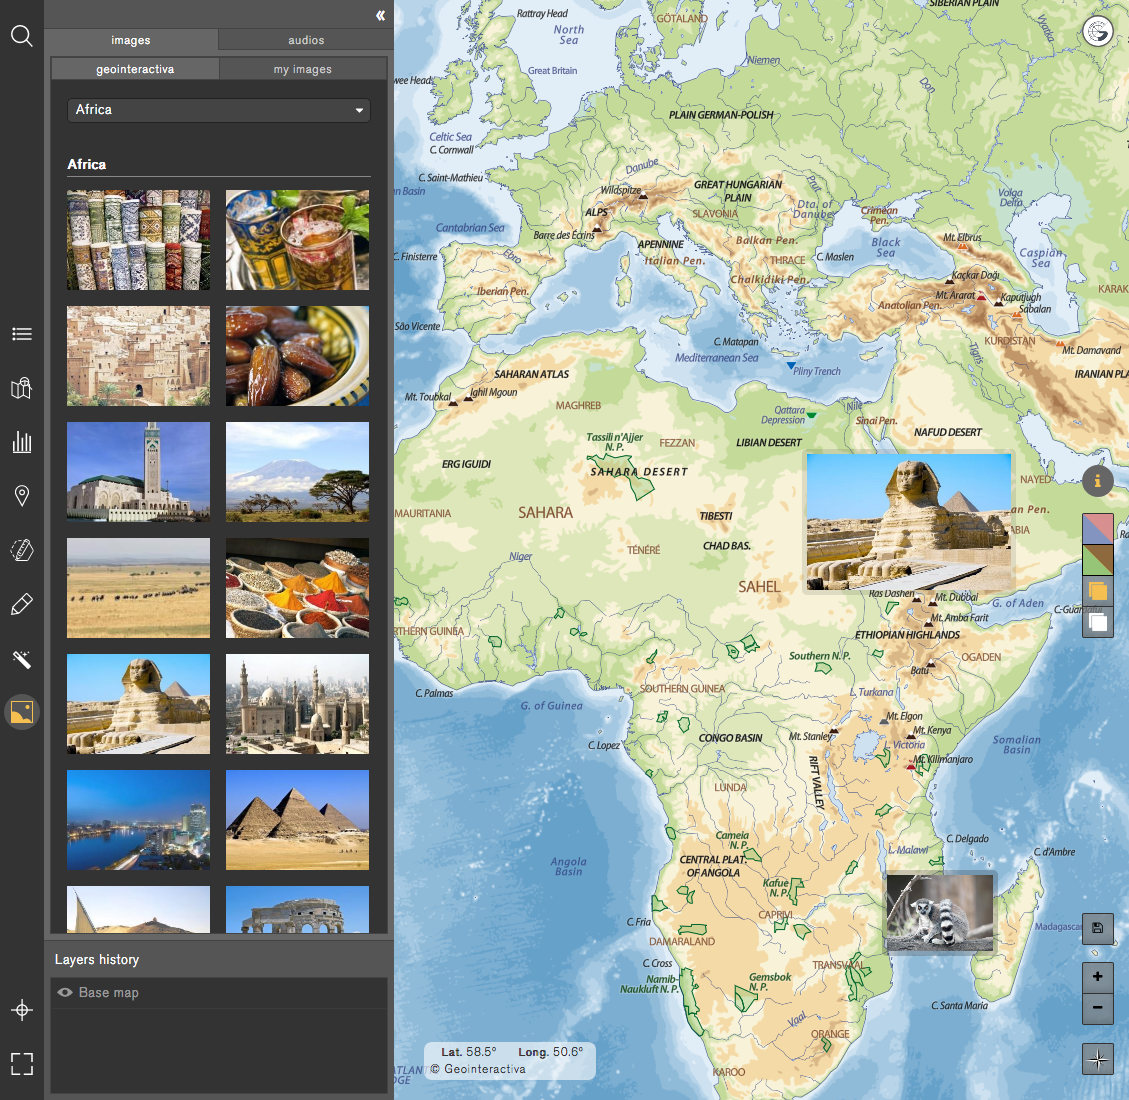
Multimedia
The multimedia content of audio and image available to the user can be expanded with the contents that the user incorporates to combine it with the rest of the map information.
Access an enjoy the site!