


Didactic proposal
Interactive geography
Pedagogy of Geointeractiva tools
Why Geointeractiva
Geointeractiva is an application designed to encourage interactive learning, away from a memoristic curricular model. An adaptive digital tool that promotes creativity in the field of geography and cartography, as well as in other disciplines.
Offering critical and creative interaction, Geointeractiva is a working online environment, where creativity and critical judgment enable an active complicity between users, information, and maps.
The tools of Geointeractiva allow the user to make personal use of the maps and available work items. The app has a rich and updated database with more than 70,000 toponyms, statistical data, graphics and multimedia content. The user can also set up and edit his own data, take it into a map, save it or even share it with other users.
The application has been mainly created from a pedagogical point of view; all the elements that compose the app have been conceived to facilitate both the learning and the teaching of the subjects. As an interactive support, the app has been made up with several content tools which allow a transversal use of the contents, in order to enhance a comparative experience within the numerous areas of human geography.
Geointeractiva is tailor made for anyone with an interest in interactive map environments. We are continuously adding to the existing tools and functions to keep improving the user experience.
Geointeractiva cartography has been mainly designed from an scholastic understanding of its usage, however, experts and professionals may also find the app as a convenient tool. The design of the application menus and map elements offers students and teachers an easy and intuitive way of learning and teaching human geography.
Maps for your needs
Create, edit and share your maps
The application has a menu of tools to configure and edit the maps hosted on it; Draw lines and polygons, locate georeferenced markers or insert your images and styles in order to edit and personalize the map in to your needs. Geointeractiva software also allows to save and share tailored maps with other users, in the social networks, or even inserted as PDF in to personal or commercial websites.
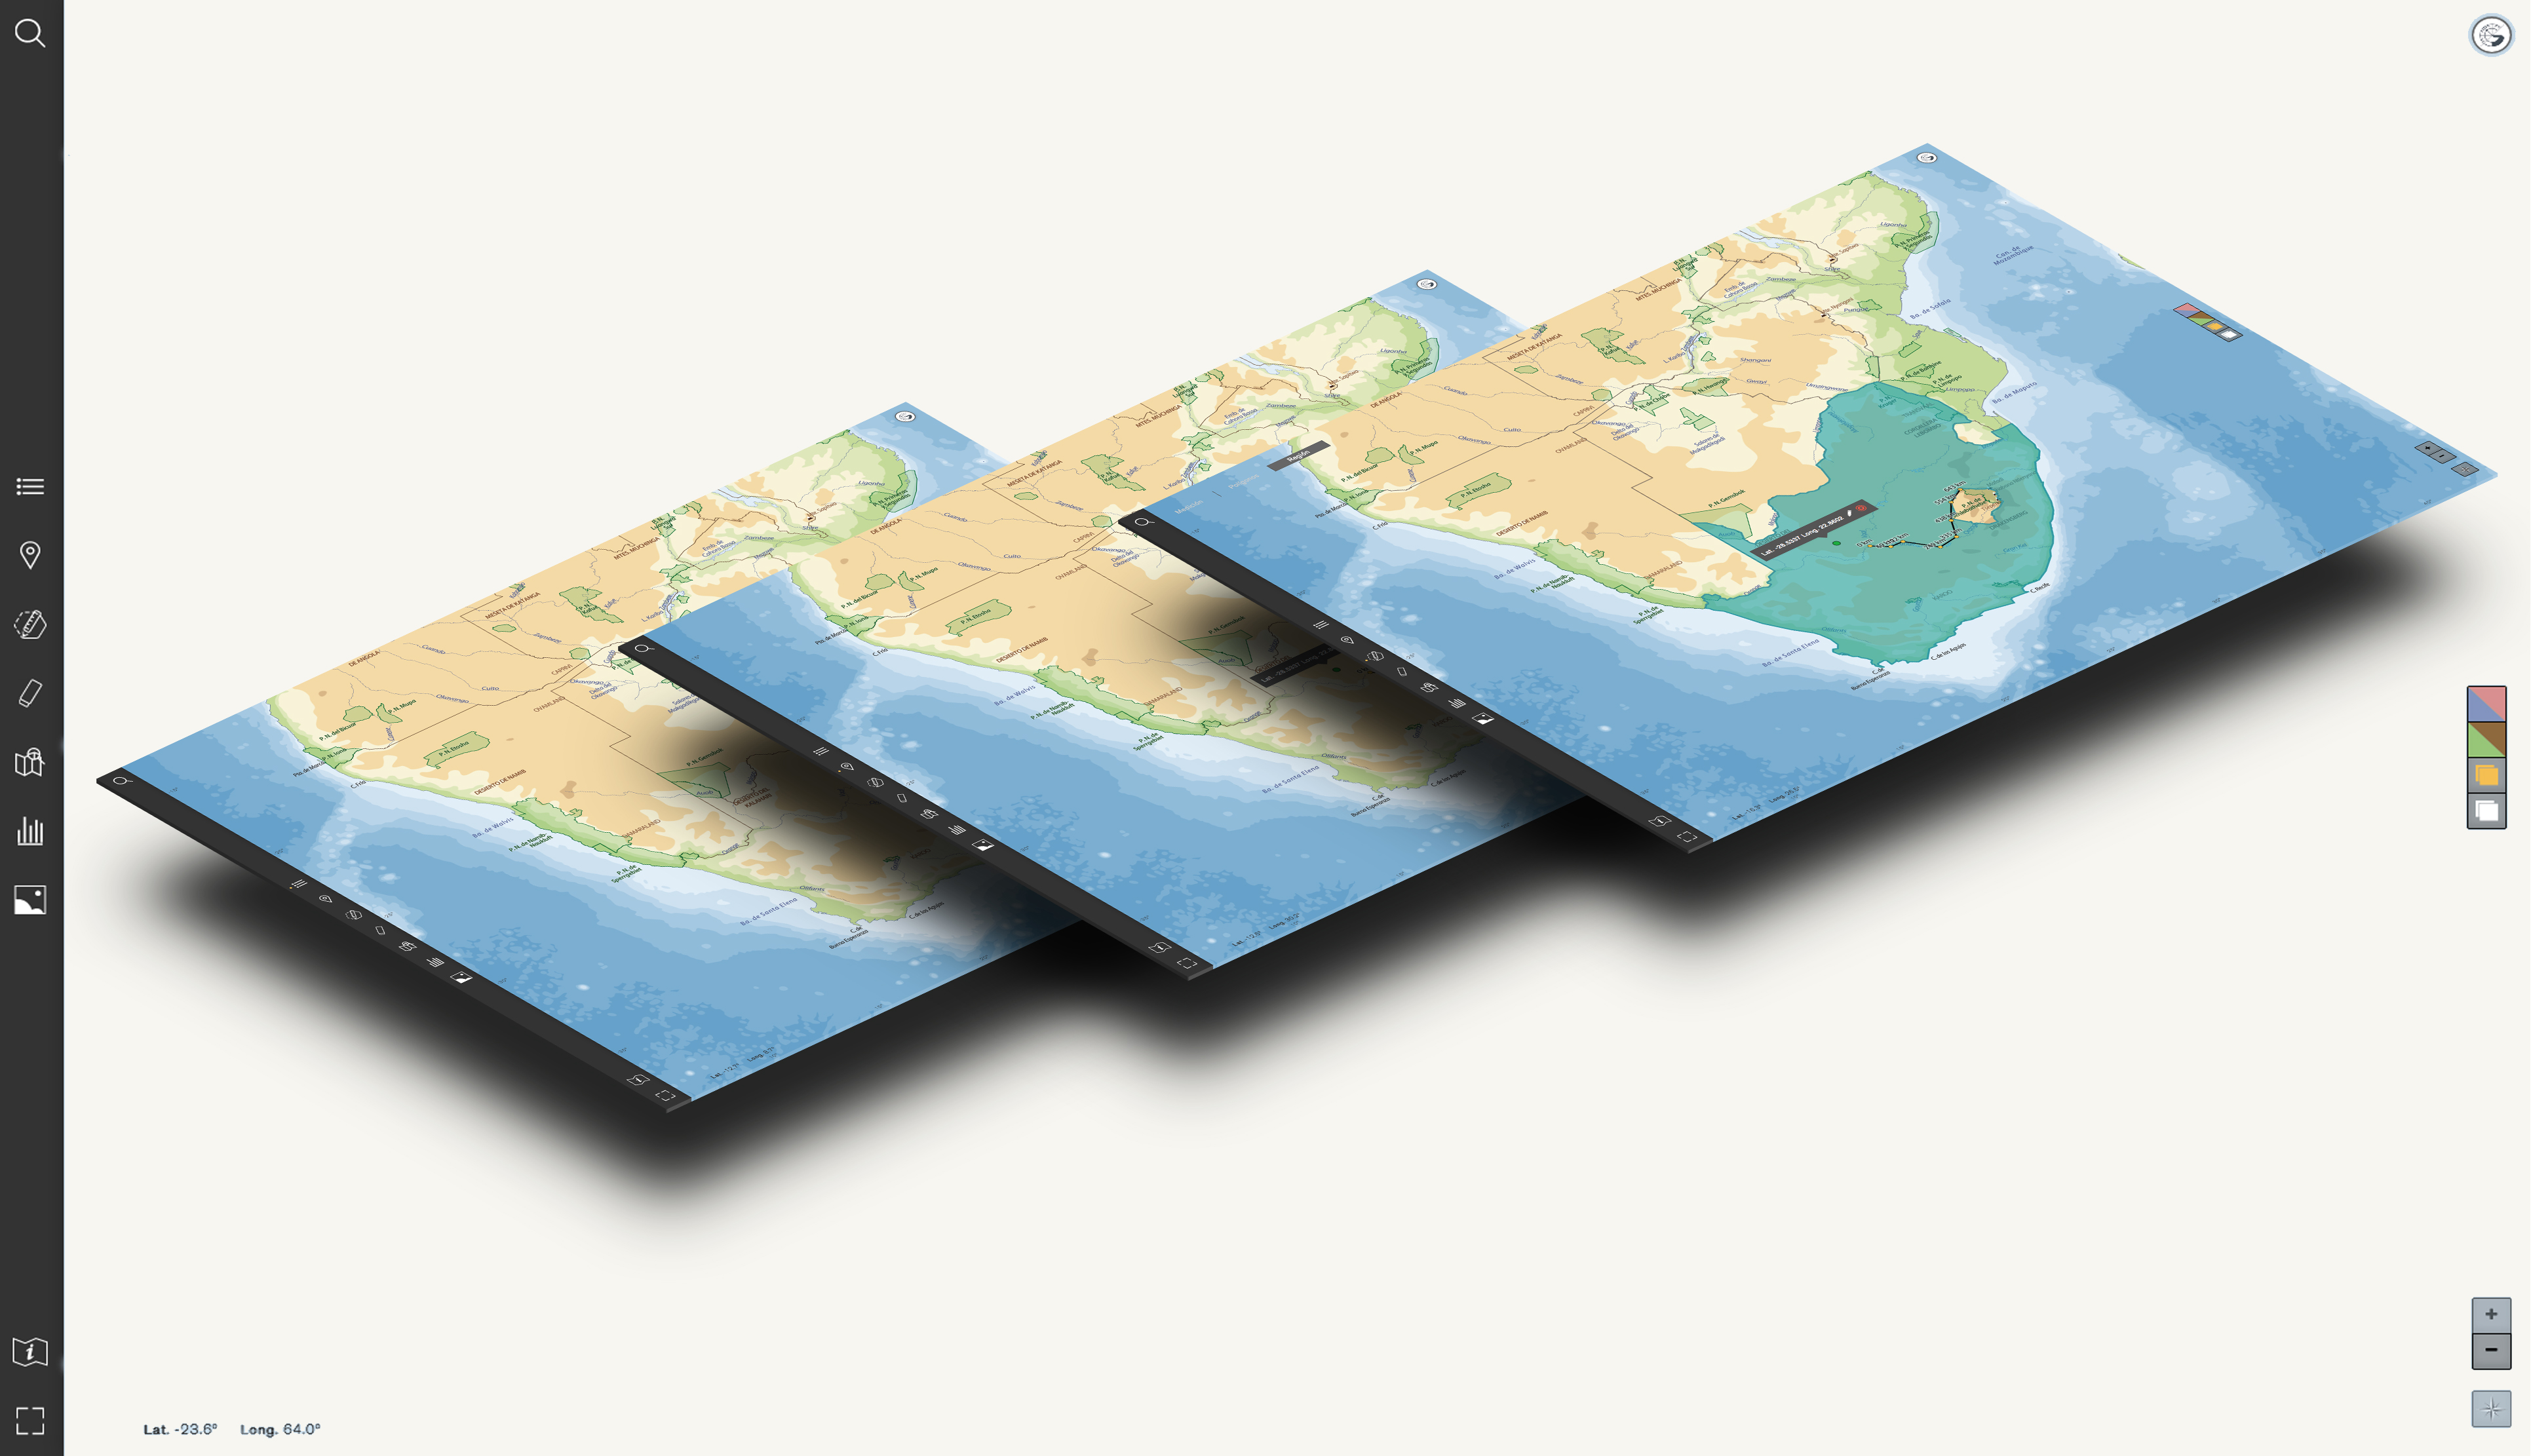
The vector maps created by Geointeractiva are visualized using a structure of layers; each element (physical or political) can be enabled or disabled depending on the interaction desired by the user. Produce a map and combine the desired information using the layers and sublayers that will allow you to hide or show the cartographic content.
In addition to the vector maps created by the Geointeractiva team, the app allows you to import open source maps (Open Maps, Stamen, NASA, etc.) and interact with cartographic data.
It is possible to import data (drag and drop) to generate graphical representations; qualitative charts (thematic maps) or quantitative charts (statistical maps), project routes to your favorite places on Earth, or recreate a multimedia presentation of your journeys. It is also possible to import or export files georeferenced in different formats (KML/KMZ, GPS/GPX, GML and GeoJSON/TopoJSON).
An educational tool
Create, use and share your maps in academic and domestic environments
With its multitude of functions, Geointeractiva offers many advantages to a conventional printed map. That means a better experience for both professor and student. Designed with WebGL technology, the app’s functionality, versatility and ease of use makes it unique. The option to embed Geointeractiva plug-in button for virtual libraries or academic intranets will also improve the users access to the app.
- Geointeractiva maps allow the editing and personalization of selected zones based on the needs of the user: You can create a thematic map of a historical period with embedded multimedia tailored for your particular educational or academic needs.
- Geointeractiva supports all major operating systems (PDI/Interactive Blackboard, MS Windows, Mac OS (iOS) and Android) and adapts to all types of screens (digital whiteboards, smartphones/tablets, etc.). It should be noted that the application was initially developed for computer screens, and has yet to be optimised for use on smaller screens.
Features of the app

Layers menu
The Layers menu constitutes the body of the original cartography of Geointeractiva. Its structure has been designed for a didactical purpose, understanding how a map is build up with its cartographic layers.
The physical and political cartographic elements of the map can be combined on the basis of need. Each element (capes and tips/coastal relief) its distinguishable from its various cartographic parts (image, point, text and line). Create maps with unique combinations of layers.
The selected items will always be displayed and accessible from the Tools menu, and can be combined with other external and user-customized layers.
Inspector button
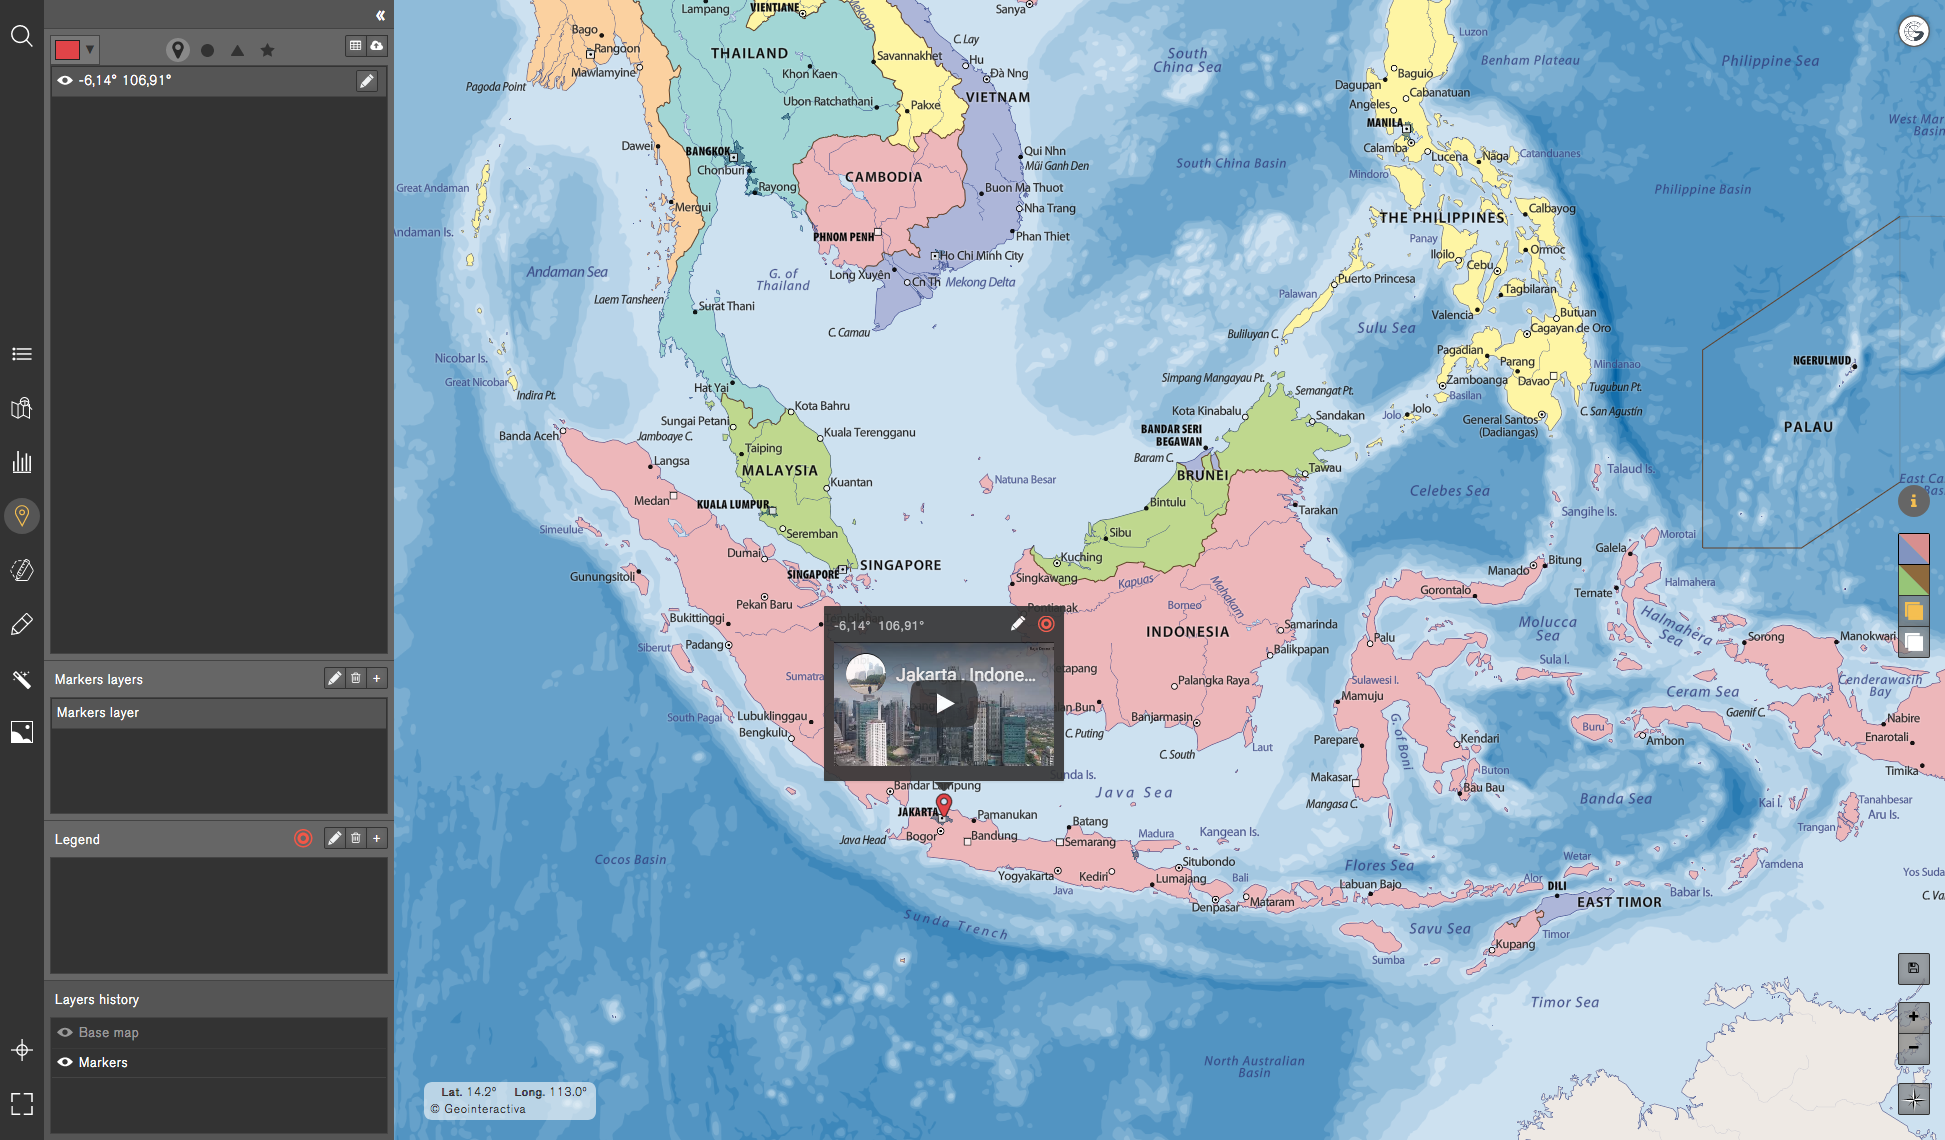
This tool allows the user to hide or show the associated information (videos, images, audio) of certain elements of the map, such as a Markers. When activated, elements with media content will be displayed as a quick view option.
Multimedia
The Multimedia tool allows the user to insert hyperlinks to graphics or multimedia content on the map. The application allows the insertion of content as a multimedia file. Files are saved and sorted by categories for easy identification. Load any file in CSV format (values separated by commas) and combine your data with the rest of layers of cartographic information, and multimedia files.
*The only condition for a CSV file to be georeferenced is that it contains the geographic coordinates of each record (the longitude and latitude) in the decimal numbering system and with the decimal value separated by a point.

Maps menu
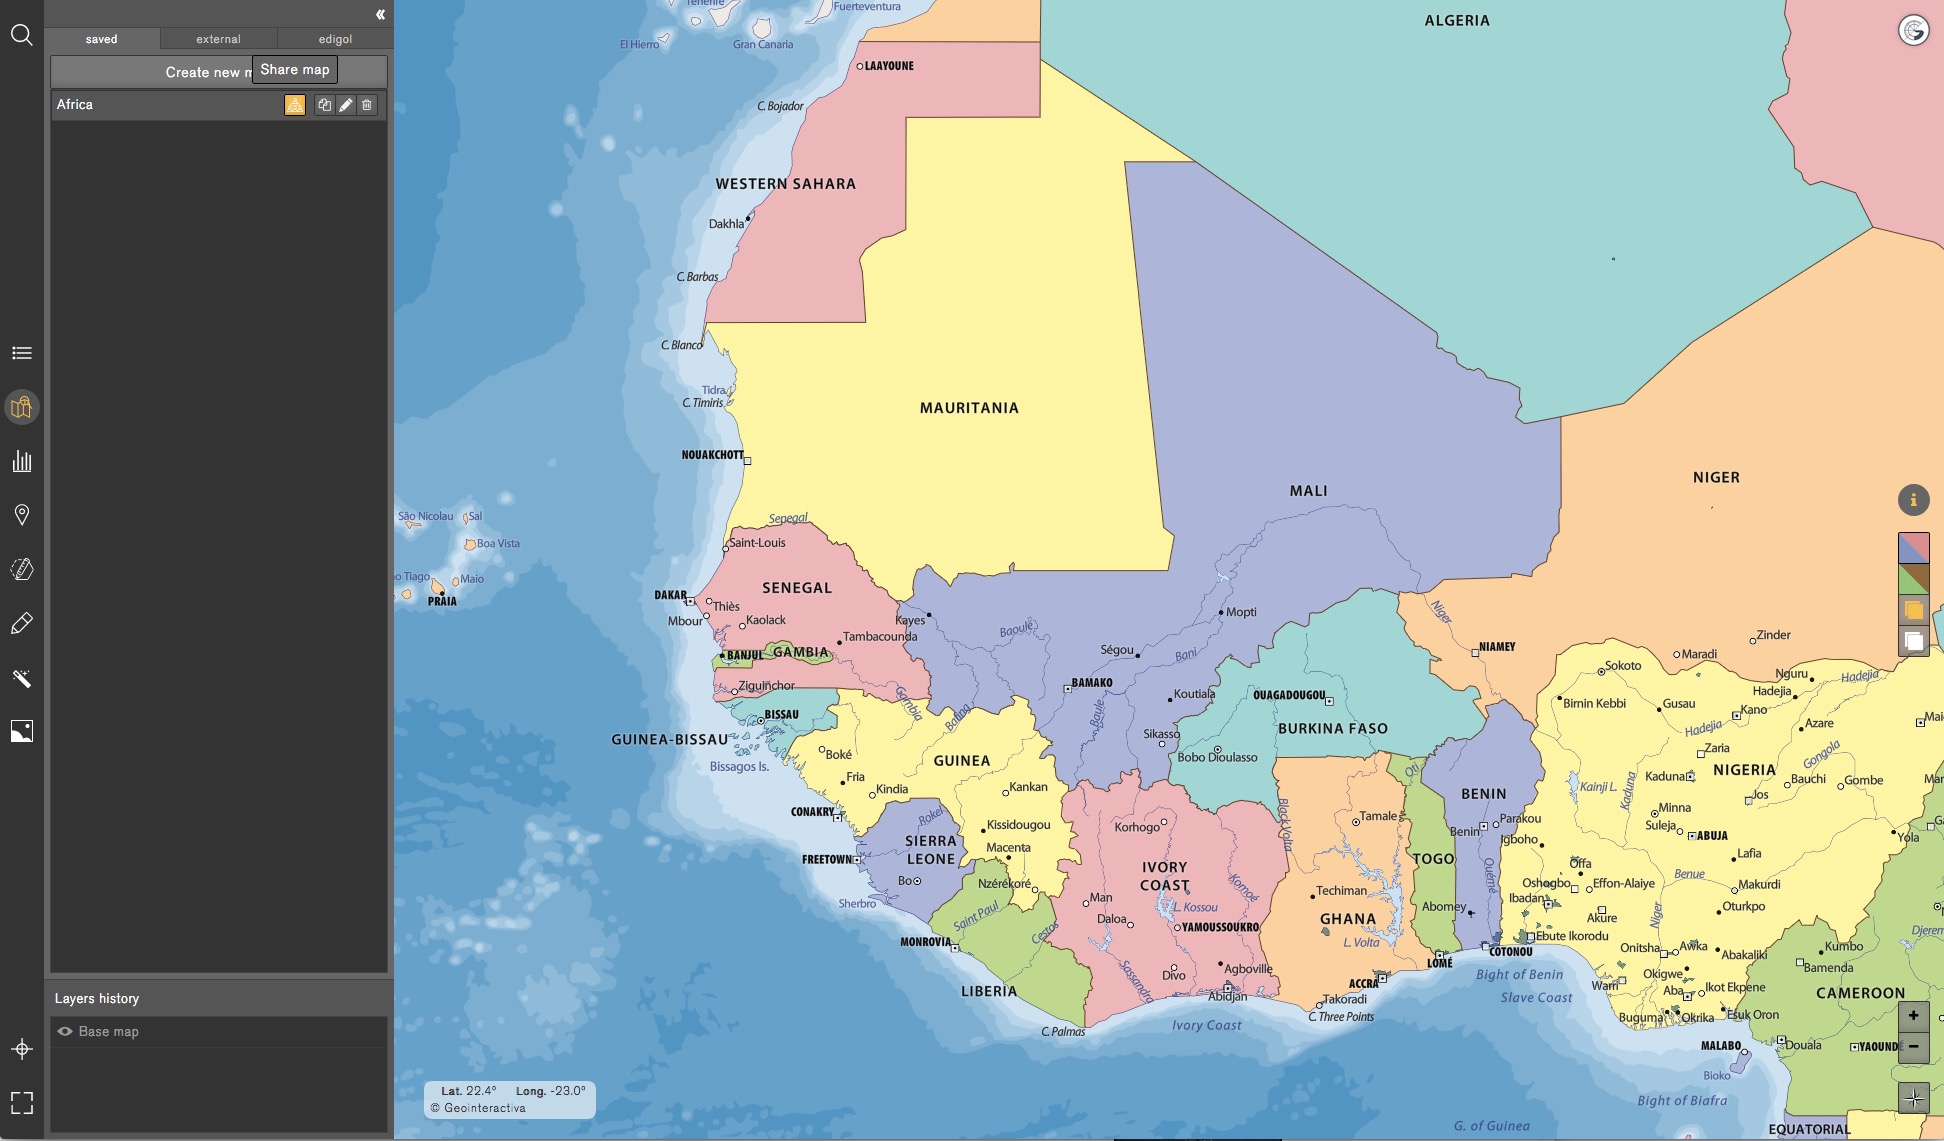
From the Maps menu, the user can access any available map: original Geointeractiva maps, Edigol Ediciones maps, open source maps and user-created maps.
The open source cartography is a collaborative and free cartographic project at a global level. The open source maps hosted in Geointeractiva have physical and political information from all over the world with urban planimetry up to a street level of detail, using the 22 levels of zoom predefined for the whole Earth.
Note that open source layers, the user cannot overlay the planimetry layers of Geointeractiva maps. However, it’s possible to generate and apply georeferenced markers and upload them as a .CSV file.
Legend
This tool is located at the bottom right of the map. It works as a dynamic legend which displays certain elements located in the map and shows all layers of geographic and cartographic interest. This tool also allows the user to display toponyms according to population.
Searcher
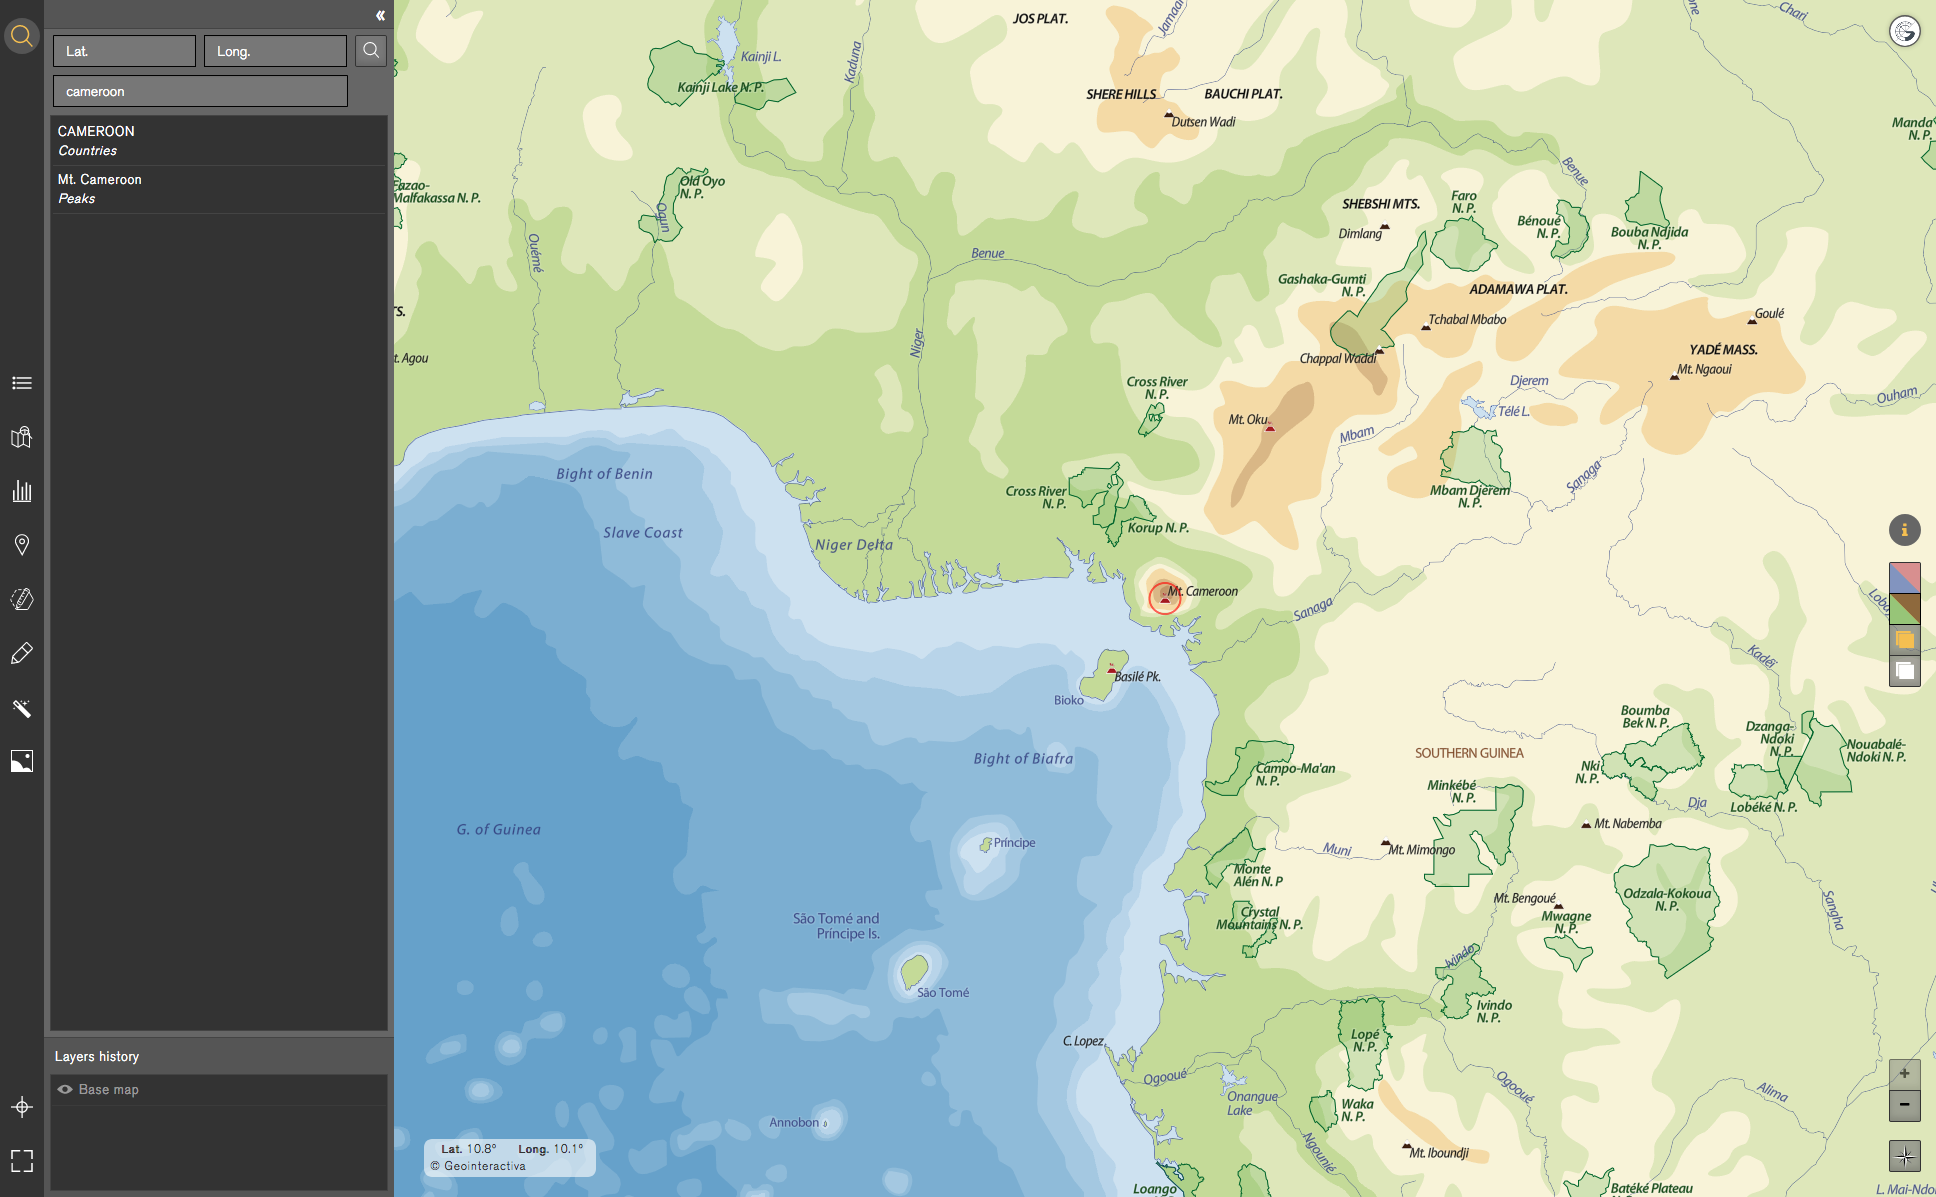
The Searcher allows the user to locate and show city toponyms by introducing a name or a coordinate.

Measurement and Magnitude
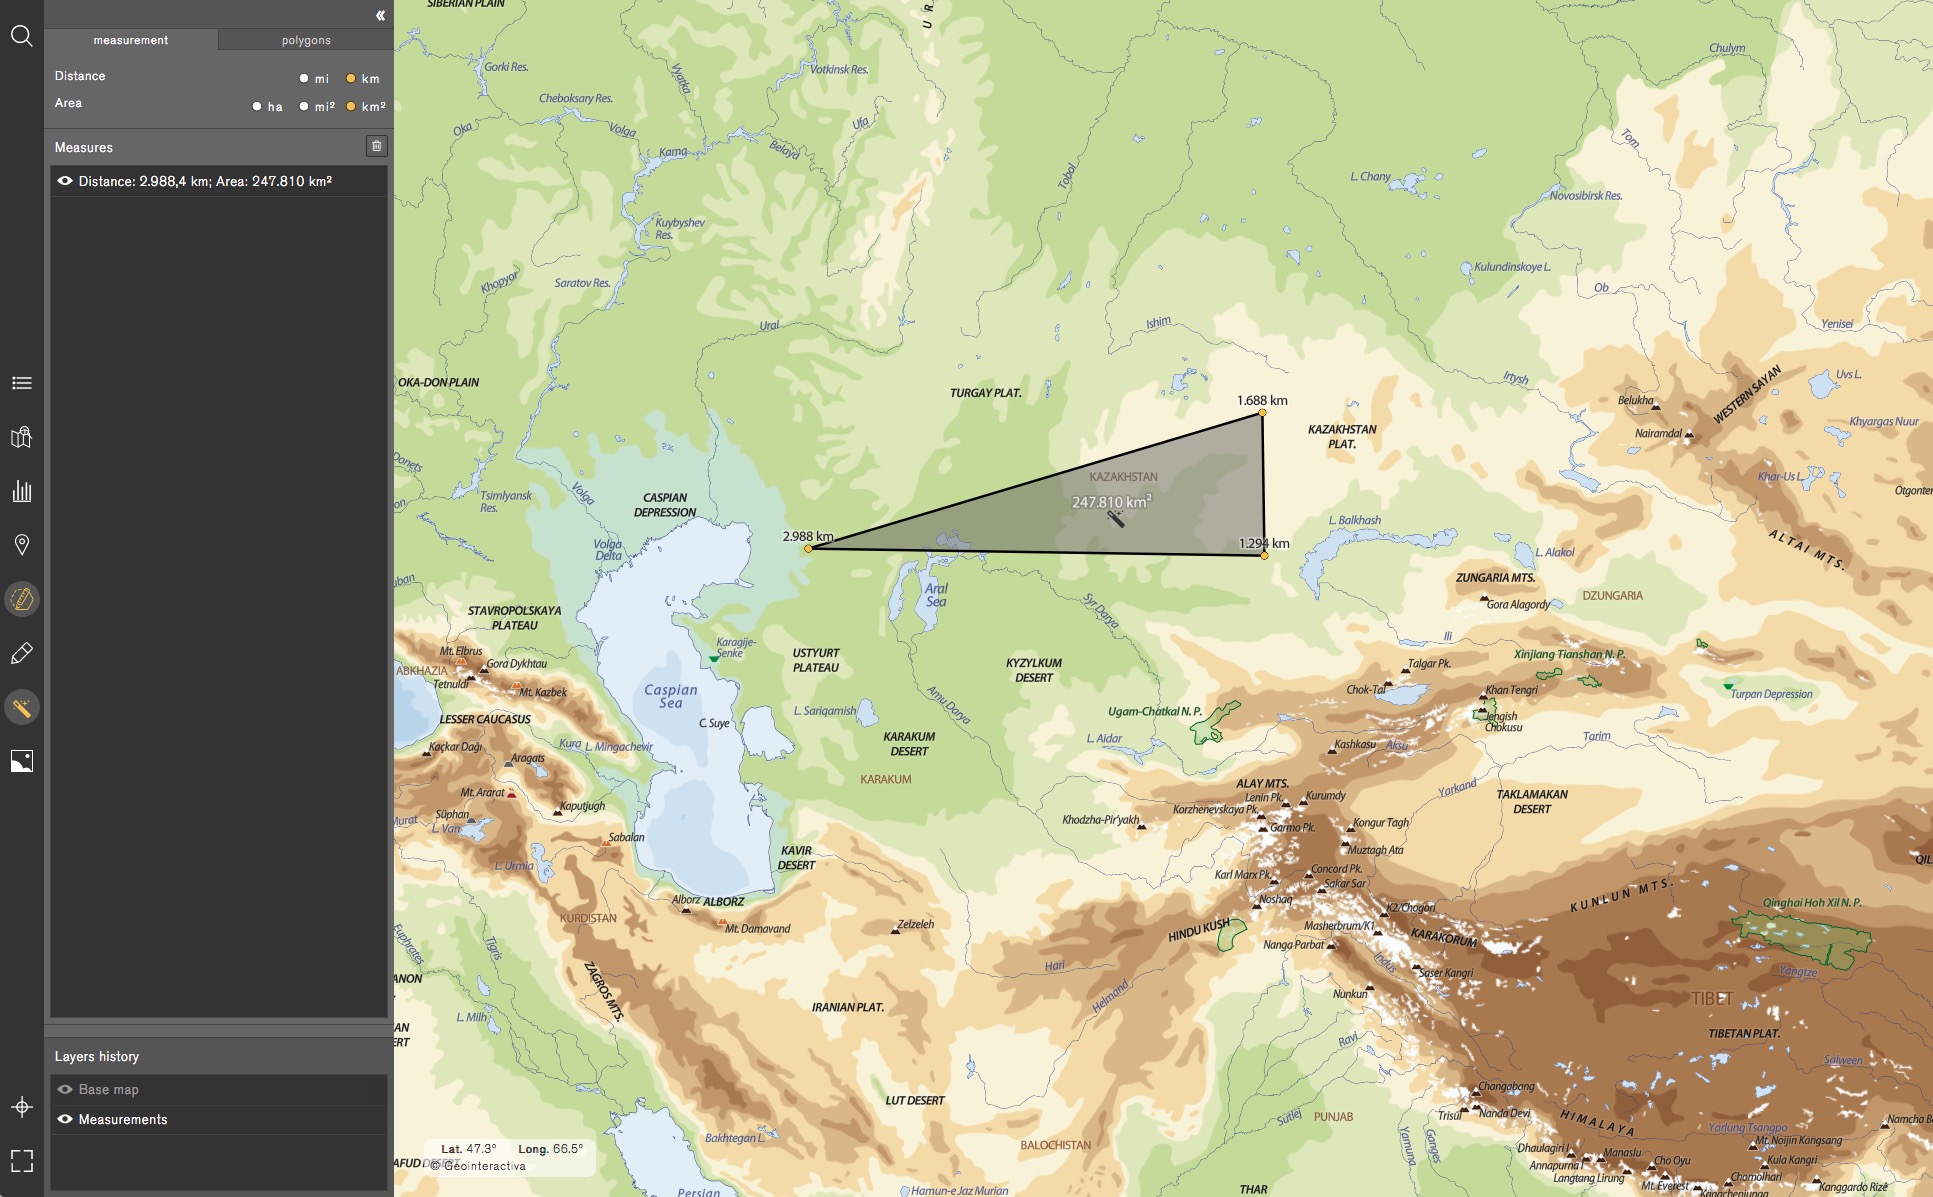
- Measurement: allows the user to measure distances or areas in straight lines by kilometres or miles. These can be stored/saved as objects in an interactive layer: Measure distances between populations, borders, routes, watercourses, as well as contours and areas of any surface.
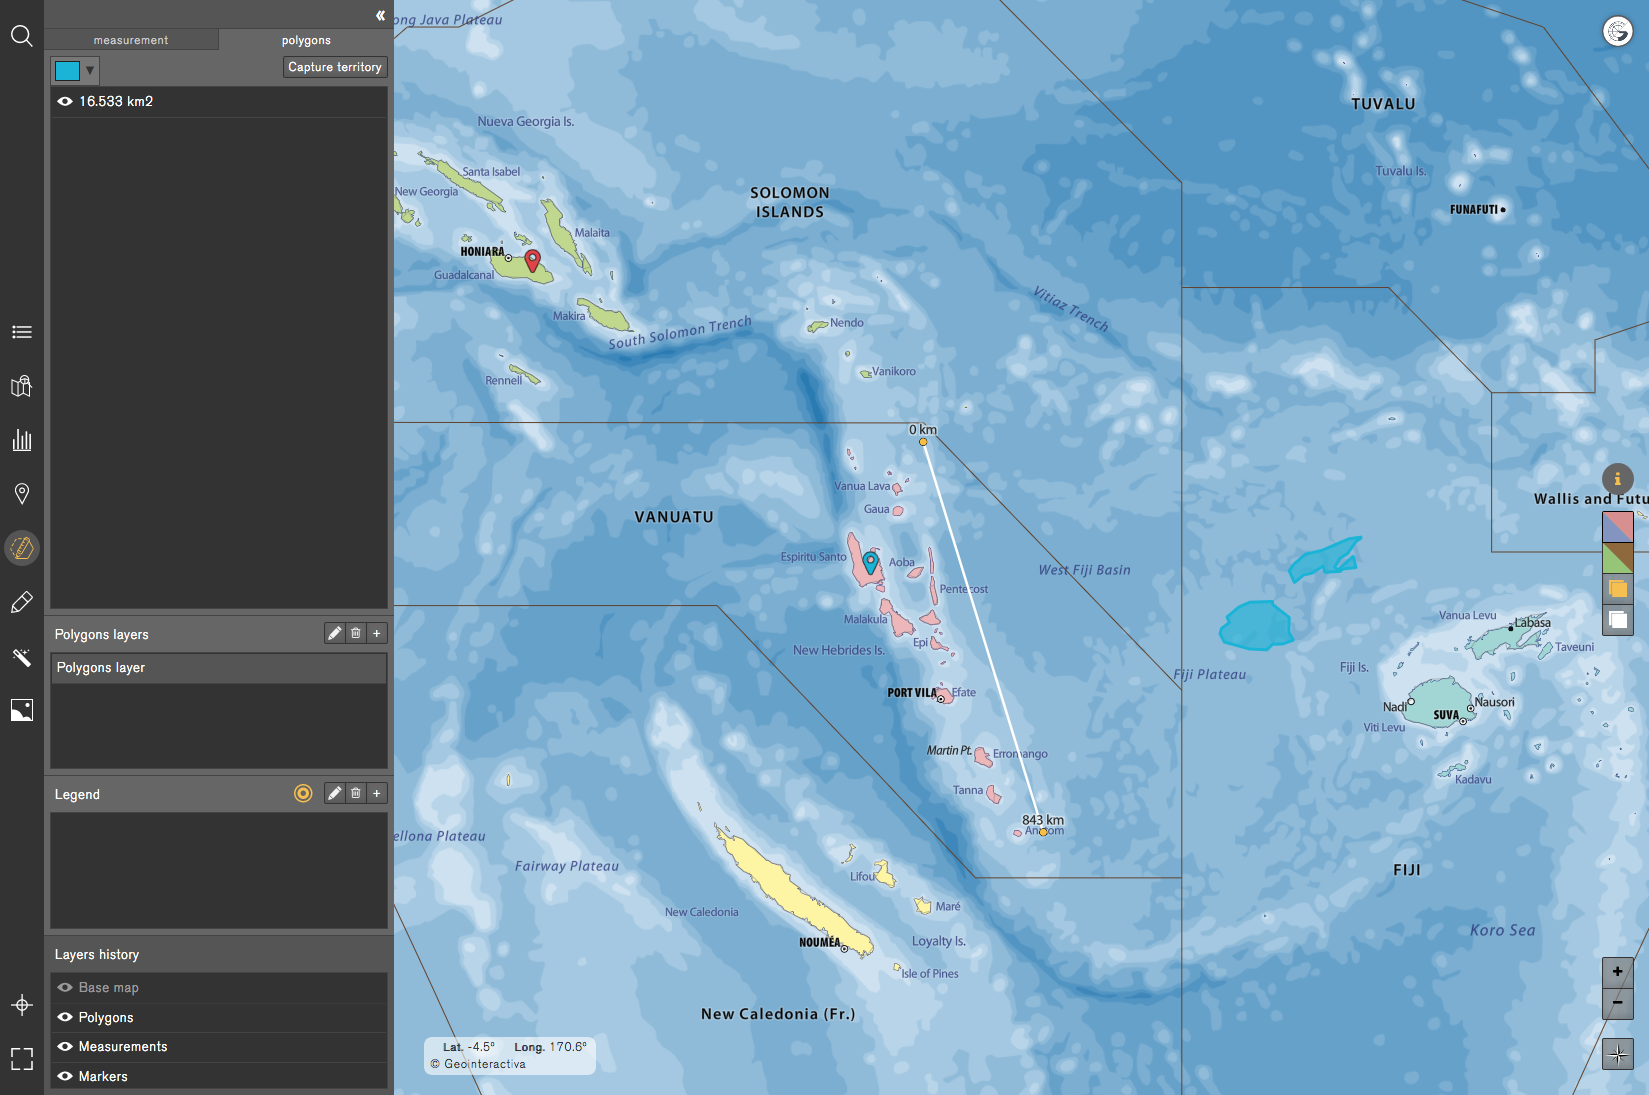
- Polygon: this tool allows you to create polygonal areas through the union of points.
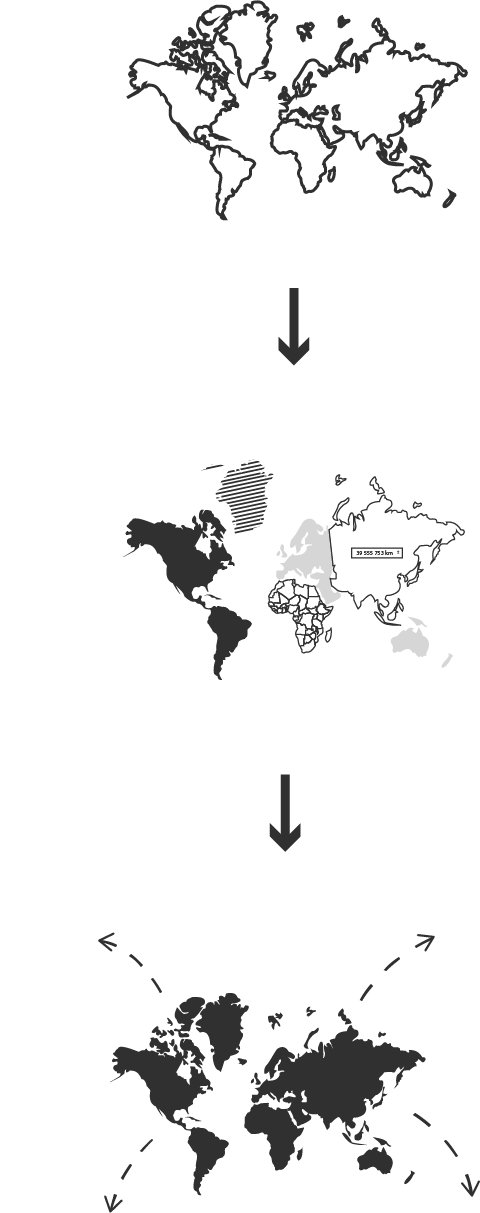
- Region: The Region tool allows the user to compare the area and the shape between two distant latitudes countries. Observe the distortion, related to the map projection, that occurs in its apparent size on the map. For example, drag Greenland to an equatorial zone will significantly reduce its size to verify that its actual area is equivalent to that of other equatorial countries in a more reduced size

Markers
The Markers allows the user to place objects to mark points on the earth’s surface on the map. It is also a graphic and audio-visual presentation tool: Markers can be edited in order to create a presentation format so that the teacher, the student, or the professional can create his own desired map.

Statistical and Thematic Maps
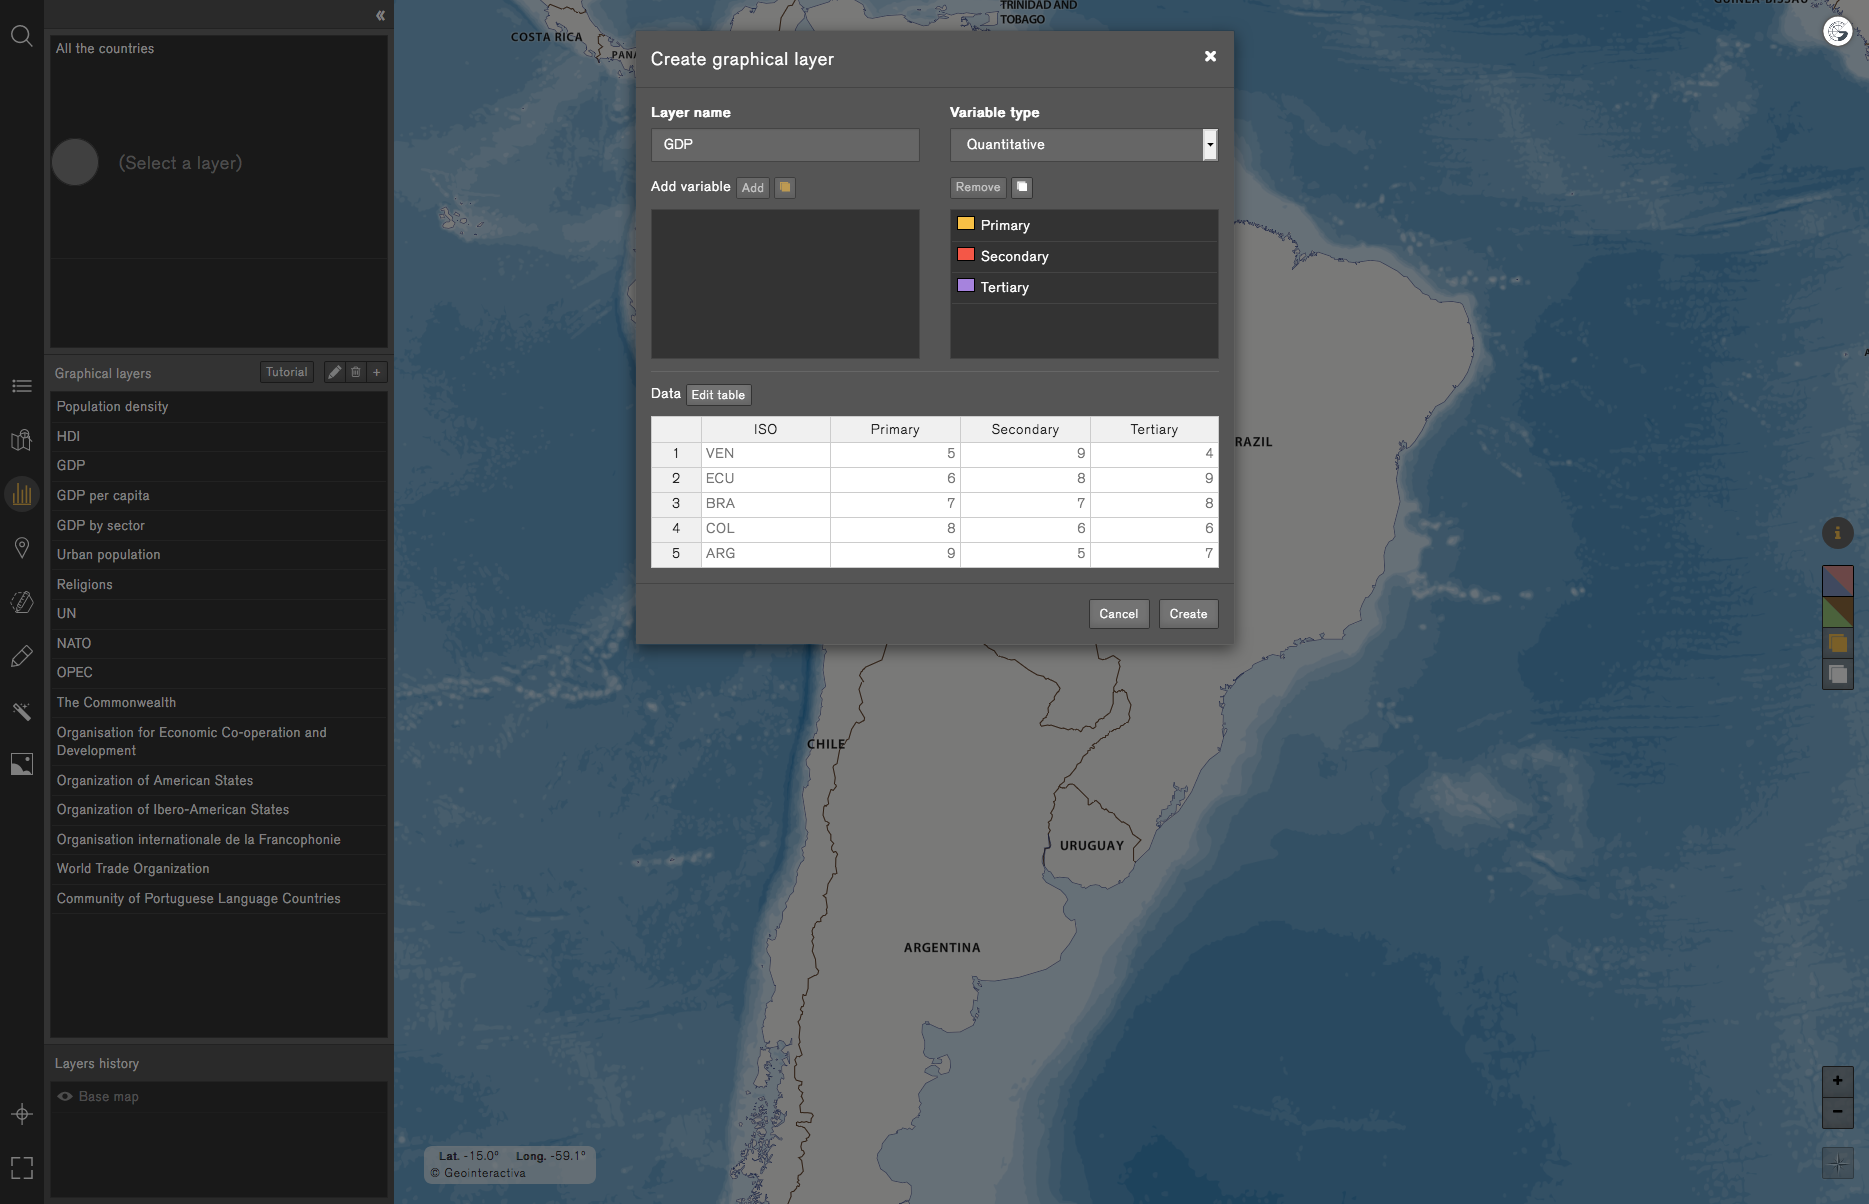
The Statistical and Thematic Maps tool lets the user make qualitative graphics (thematic maps) or quantitative graphics (statistical maps). When selecting Create Statistical map or Create thematic map, an editor menu will be displayed where you can work the desired action.
Games
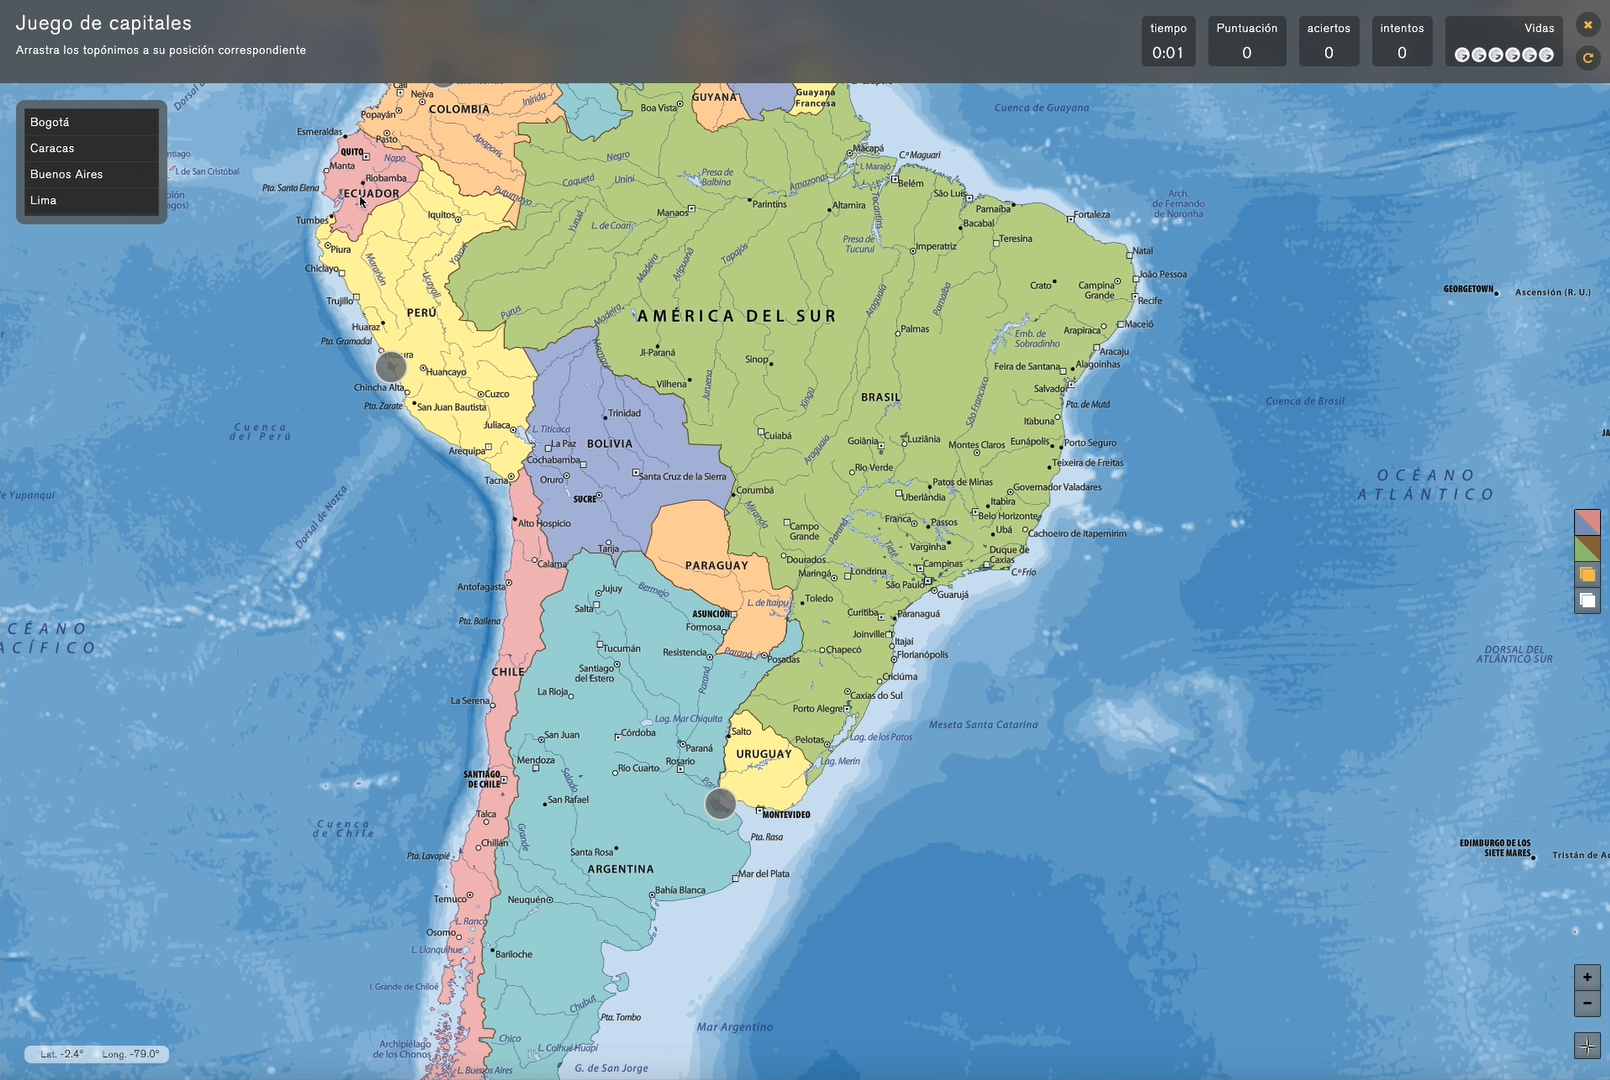
Start playing with the default games or create them yourself. You can establish questions of physical and political layers of each of the maps or ask about statistical data from the statistical and thematic maps tool. There are three types of games:
- Drag toponyms and place them on the map
- Write toponyms
- Drag statistical data from data tables created by Geointeractiva or by the user
Eraser
The Eraser tool allows the user to eliminate any element of a map generated by the user.
Saving your map
This feature allows the user to save maps and share them with other Geointeractiva users through the Interactive Classroom or through the Forum: Two environments of the app where users can share or evaluate other maps and work in groups within the same map session. Additionally, maps can be shared through out social networks.
Layer History
This tool is hosted in the Editor menu and lists the total number of layers displayed on the map in real time. It also lets the user interact with those layers by hiding or displaying different layers.
Geointeractiva app work areas
The app can be accessed online (Geointeractiva), as a plug-in button incorporated into the virtual libraries or academic intranets.
Tools scheme
Interactive classroom
It is an area designed for the Academic subscribers in order to share maps and perform tasks in group.
My Account
My account is the place where the user can manage or modify his or her subscription, access to the maps, and the rest of the Geointeractiva environments, like the Forum or the Interactive Classroom.
Maps
This menu stores and displays all the maps available for each subscription, as well as the maps saved by the user and/or shared with other users. As an example, the teacher can select whether he wishes to keep a map private in his personal session or if he wants to share it with the students through the interactive classroom.
Forum
The Forum is a message board where users can contact the Geointeractiva team with questions, issues or troubleshooting regarding the app. The forum can also be used to share and discuss maps created in Geointeractiva.*
*The team of Geointeractiva is responsible for solving any problem in a time margin not greater than 48 hrs.
Profile
The Profile menu is where the user can edit his account details, personal payment details, or manage his or her subscription.
Technical scheme of the app
The database hosts different layers of maps, toponyms and statistical data, and runs in a Mapbox Vector Tile and JSON format. It also stores the user’s data as well as his custom maps.
The server has been developed in PHP and is an intermediary between the client and the database, managing the sessions of each user.
The client viewer has been developed in HTML5 and Javascript, and it connects securely (https) to the Geointeractiva server to download the layers that are displayed in the client app.
The programmers have focused on the app's UI and performance (specifically with regards to loading times for graphic and alphanumeric information) and smooth map navigation. A smooth navigation through maps, with the mouse scroll or when zooming into the map. The app is compatible with mobile devices and tablets, using multi touch capabilities of the different devices.
Geointeractiva uses WebGL as a rendering engine: WebGL allows the user to view hardware rendered graphics, which improves the application performance. In addition, the app works with all current browsers, without requiring any plugins or external complement.
Maps are exported in vector format (MapBox Vector Tile). Vector graphics are superior to pixel or bitmap image format and allows the optimization of the maps interactivity.
The structure for the cartographic bases are vector source type which makes it possible to combine the graphic precision with their different scale variations depending on the geographical coverage represented: the world, continents, countries, regions, etc.
Cartographic information has been adjusted, processed and composed using various geographic information systems (GIS) and mapping specific applications implemented in vector drawing programs.
The maps territorial bases have been obtained from a public domain site, Natural Earth Data. All vector data are seamlessly integrated into our application and the scale basis used is 1 : 10 000 000.
Databases are georeferenced using WGS84 as datum, or origin of the geographic coordinates, and are reprojected on each map by a Mercator projection derivation: the Pseudomercator (EPSG: 3857). This projection coordinates system is used to render maps in most of web cartographic applications.
The Pseudomercator projection uses the spherical development of ellipsoidal coordinates, with an area of use that goes between 85.06 º North and 85.06 º South, and has two main coordinate axes: the Greenwich meridian and the Equator. Cylindrical projections allow to plan North-South and East-West routes in straight lines (vertical or horizontal). It also allows to plan rhumb lines (loxomodric routes) allowing to maintain a constant course in the navigation; every planned course appears like a straight line in the map and the same way it maintains the forms and the angles of the different elements represented in the terrestrial surface.
The graphic content is structured in different layers of information divided into thematic map areas: physical, political, thematic, statistical. Optionally, layers can also display maps from external bases (mainly Open Source: OpenStreetMap, Openweathermap, NASA Cartography, Stamen Design maps, etc.).
The application was made to offer the ability to create a tailor made experience, the application offers the ability to import georeferenced data in CSV, GPX or GPS format in order to allow the user the display of statistical data, routes or markers routes; geolocate and display on the maps any saved route with assigned geographic coordinates.
Geointeractiva runs with a database of over 70.000 toponyms. All data has been selected, processed and integrated by the Geointeractiva team and comes from accurate public databases, as well as with all of statistics studies of institutions and governments.
Users according to subscription
Types of users
The Individual subscriptions have a limit of users to be able to share a session with. In this way, a user with an Individual subscription will be able to access the maps of Geointeractiva, and also the maps that other users have published, and hosted in the Forum. Users with an Individual Plus subscription can also manage roles (admin*) to use the Interactive Classroom**, with a limit of three users in every shared session.
It is an account linked to an Admin and this to a Superadmin. Only Academic users have the capacity to host and share maps in the private space Interactive Classroom.
- Interactive Classroom: In the Account space, users with an academic subscription will find the Interactive Classroom. In this space the courses of your institution will be displayed and within each course you will be able to see and access the maps that have been created and named by any Admin of your institution.
- Admin/Superadmin: The types of administrators have been created to grant a management role to the institutions that comprise a group of centers so that they can choose and edit which centers will have the option of using the Geointeractiva app. Those professors who wish to generate activities in the Interactive Classroom will be able to select the users, classes and courses with which they wish to share the sessions in course or the created maps.
Admin & Super admin*: The types of role administrators have been created to give to the institutions/entities an account profile managing tool. In order to ease the junction between the professors and students networked in the same academic center. Those Admins who wish to share maps through the Interactive Classroom can select the users, classes, courses, or centers, with which they want to share the sessions or the maps created in the Geointeractiva app.
Aula Interactiva**: The Interactive Classroom is space where users with an Academic subscription is able to create a shared room where to share those maps created in order to be worked in group. Only Admins profiles are able to create new rooms and invite those networked users within their subscription.
Exercise proposals
Find out how to complement the use of Geointeractiva with the exercises and activities that we propose below. Depending on the initiative and creativity of each teacher, and the students feedback, the level of difficulty can be gradually increased with other exercises and activities.
We propose next a series of exercises of cartographic representation of the planimetry (bathymetry, Hipsometría, orography, hydrography, etc.), exercises of toponymy identification (populations, capitals, regions, etc.) among others.
Exercises with the Planimetry
Geographical location of an element
Activity 1 Place or locate any point on the Earth (cities, natural landscapes, units of relief, etc.), as well as other items represented in the maps in order to understand and learn how to locate and place the regions of the world in a map.
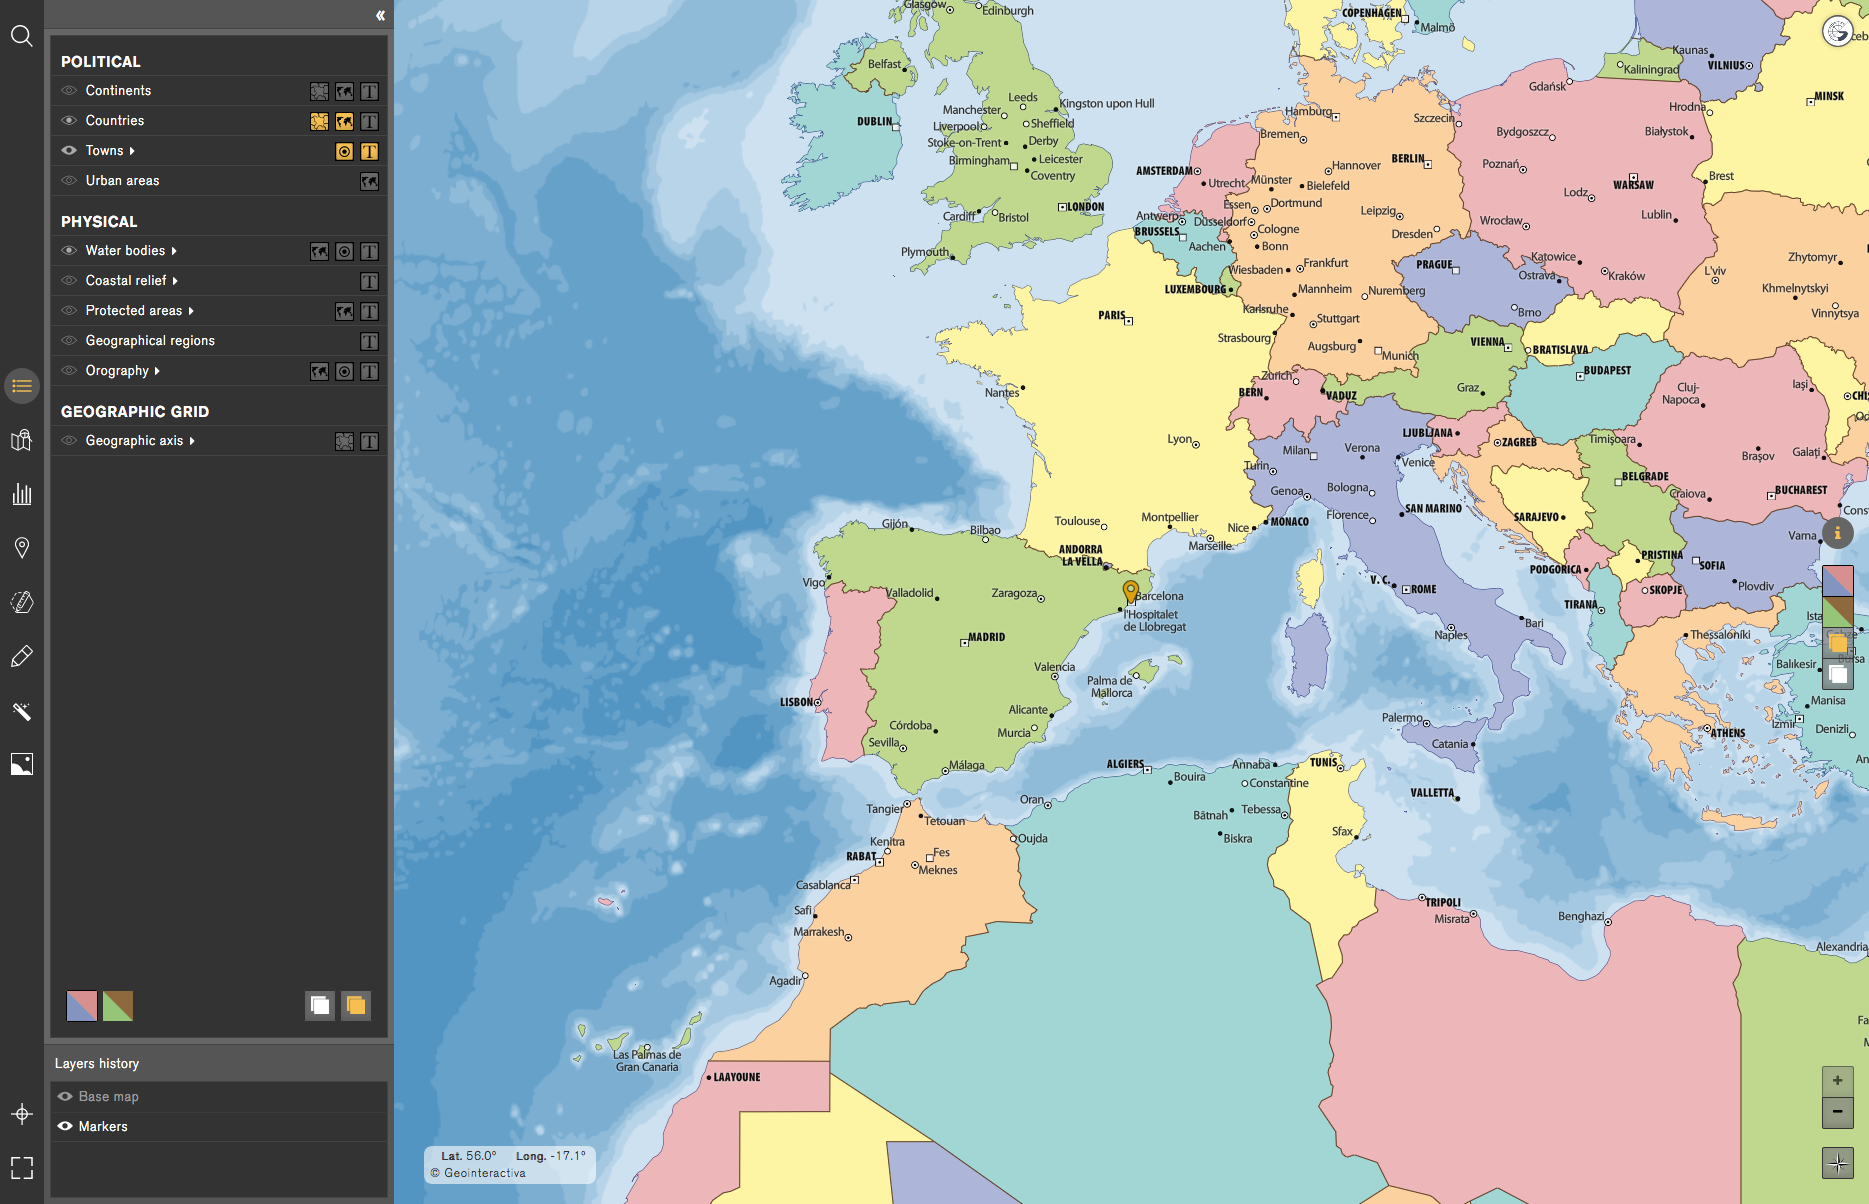
Step 1. In order to hide the toponymic information to simplify the map, we will delete all layers of the map and just activate the border layer and the graphical layer of the countries.
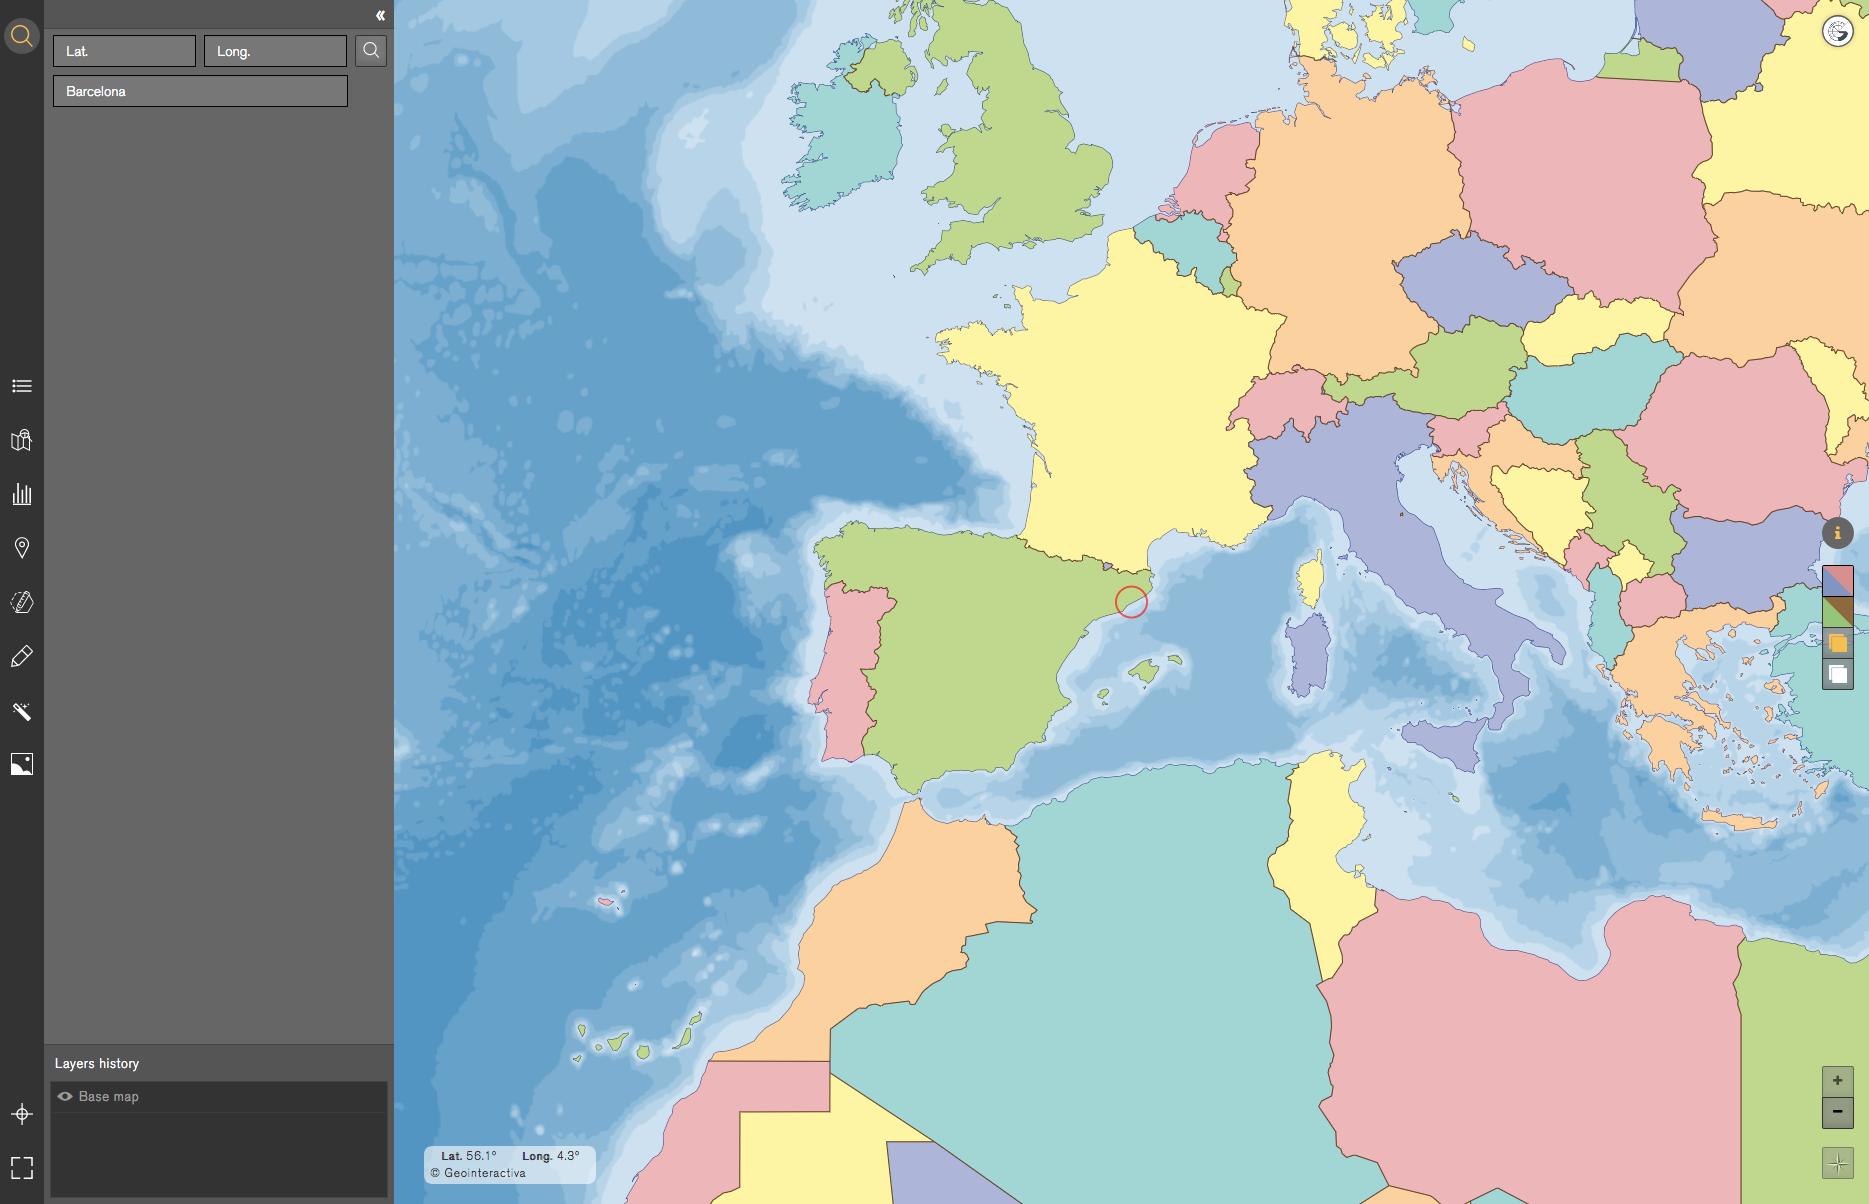
Use the search engine tool to enter the coordinates of any toponym and an indicator will show in the map the coordinates of the searched region.
Step 2. Once we have located the region on the map, we will then place a marker and write the name of the region.
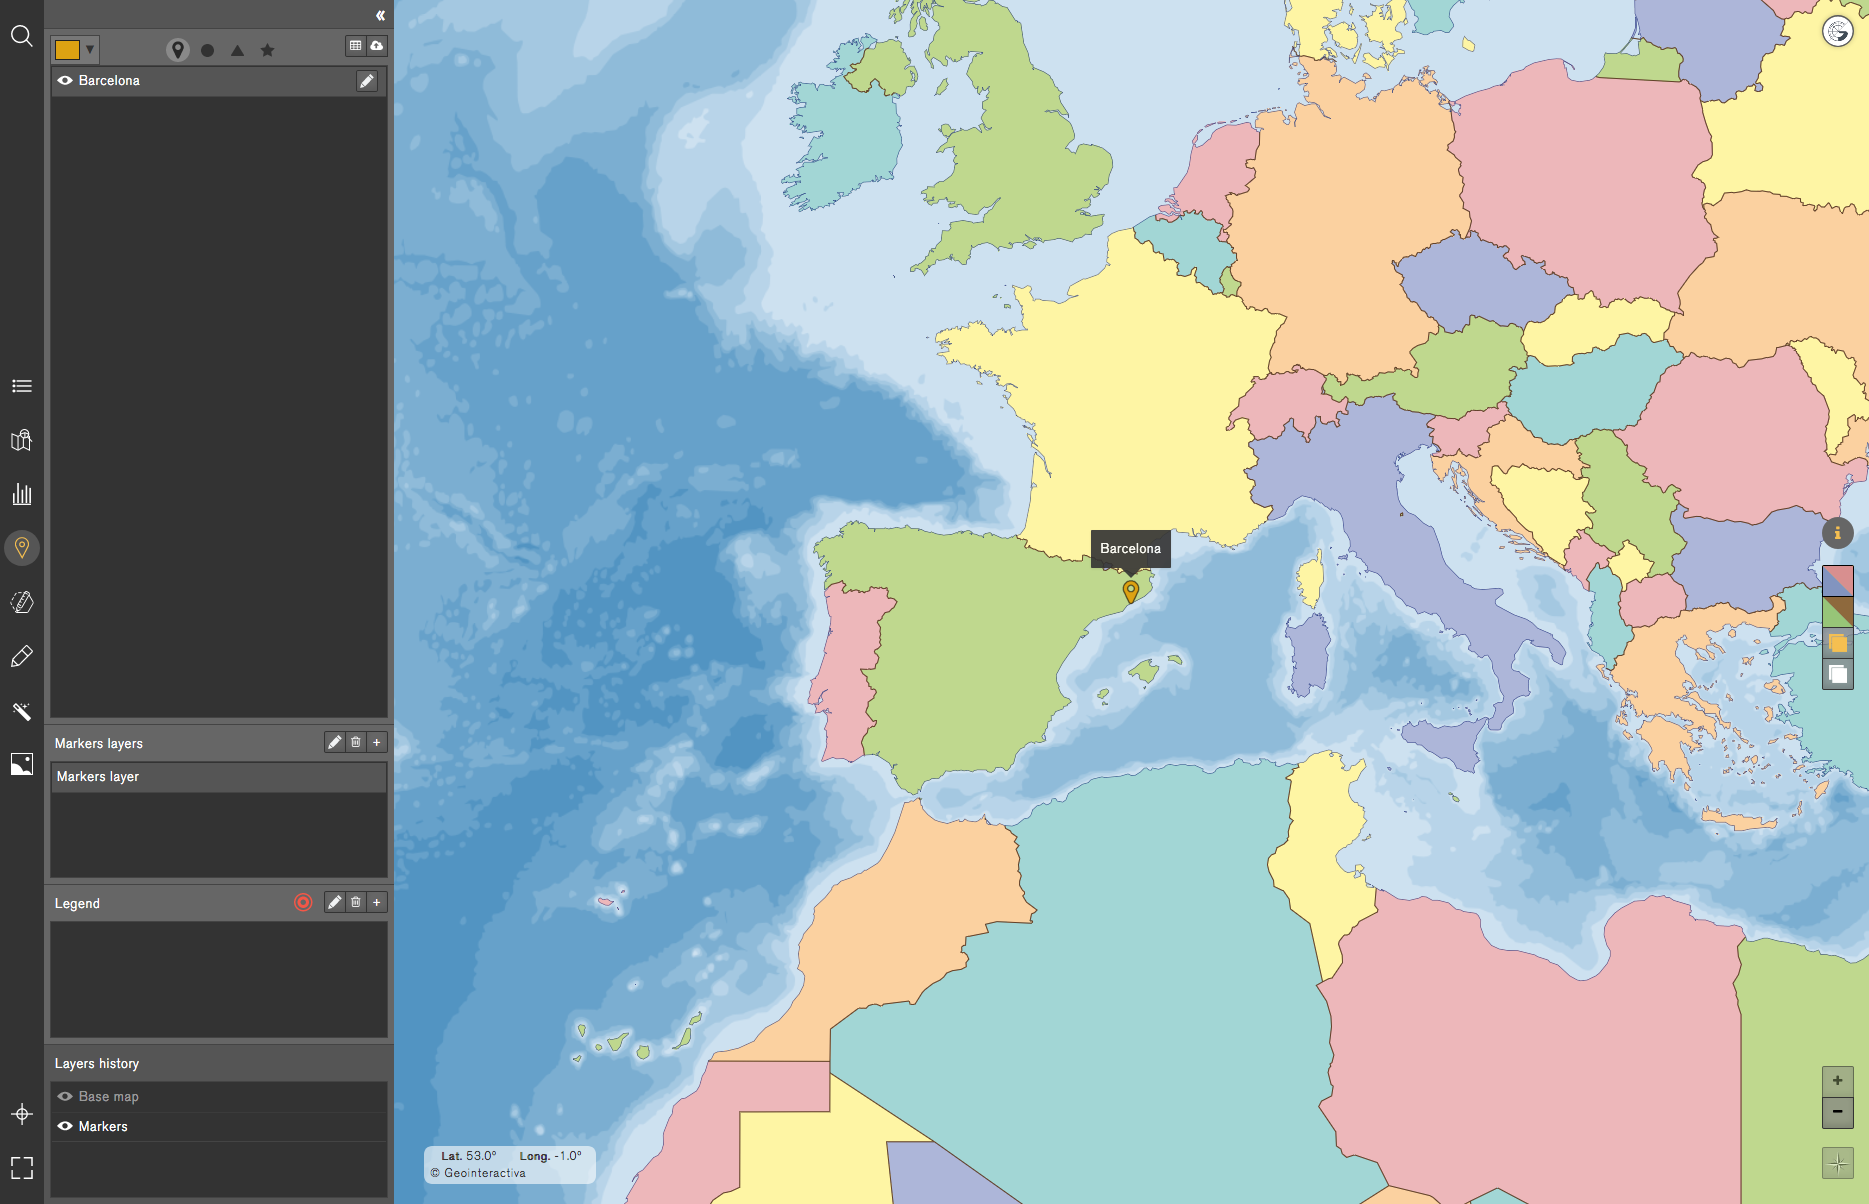
Step 3. We will finish the exercise by activating the text layer of the populations in order to prove and confirm that the marker and the name of the written region match with the toponym of the map.
Activity 2This activity purpose is to understand and correctly position on the map; using the coordinate viewer (located at the bottom left of the map), we will be able to recognize any element of which we know its coordinates.
Activate the political map and the geographical axes and begin to scroll the mouse around the map to see how the latitude or longitude increase or decrease. Once we understand the coordinates operative, we will know how to place coordinates on the map.
Recognition of the territorial areas
ActivityImprove your territory recognition skills with the Region function of the Measurement tool, which allows to overlap and compare one area of the map to another.
Click on any country in order to generate its area. Once the country area is created, we can drag and place it at any point on the map, as well as changing its color.
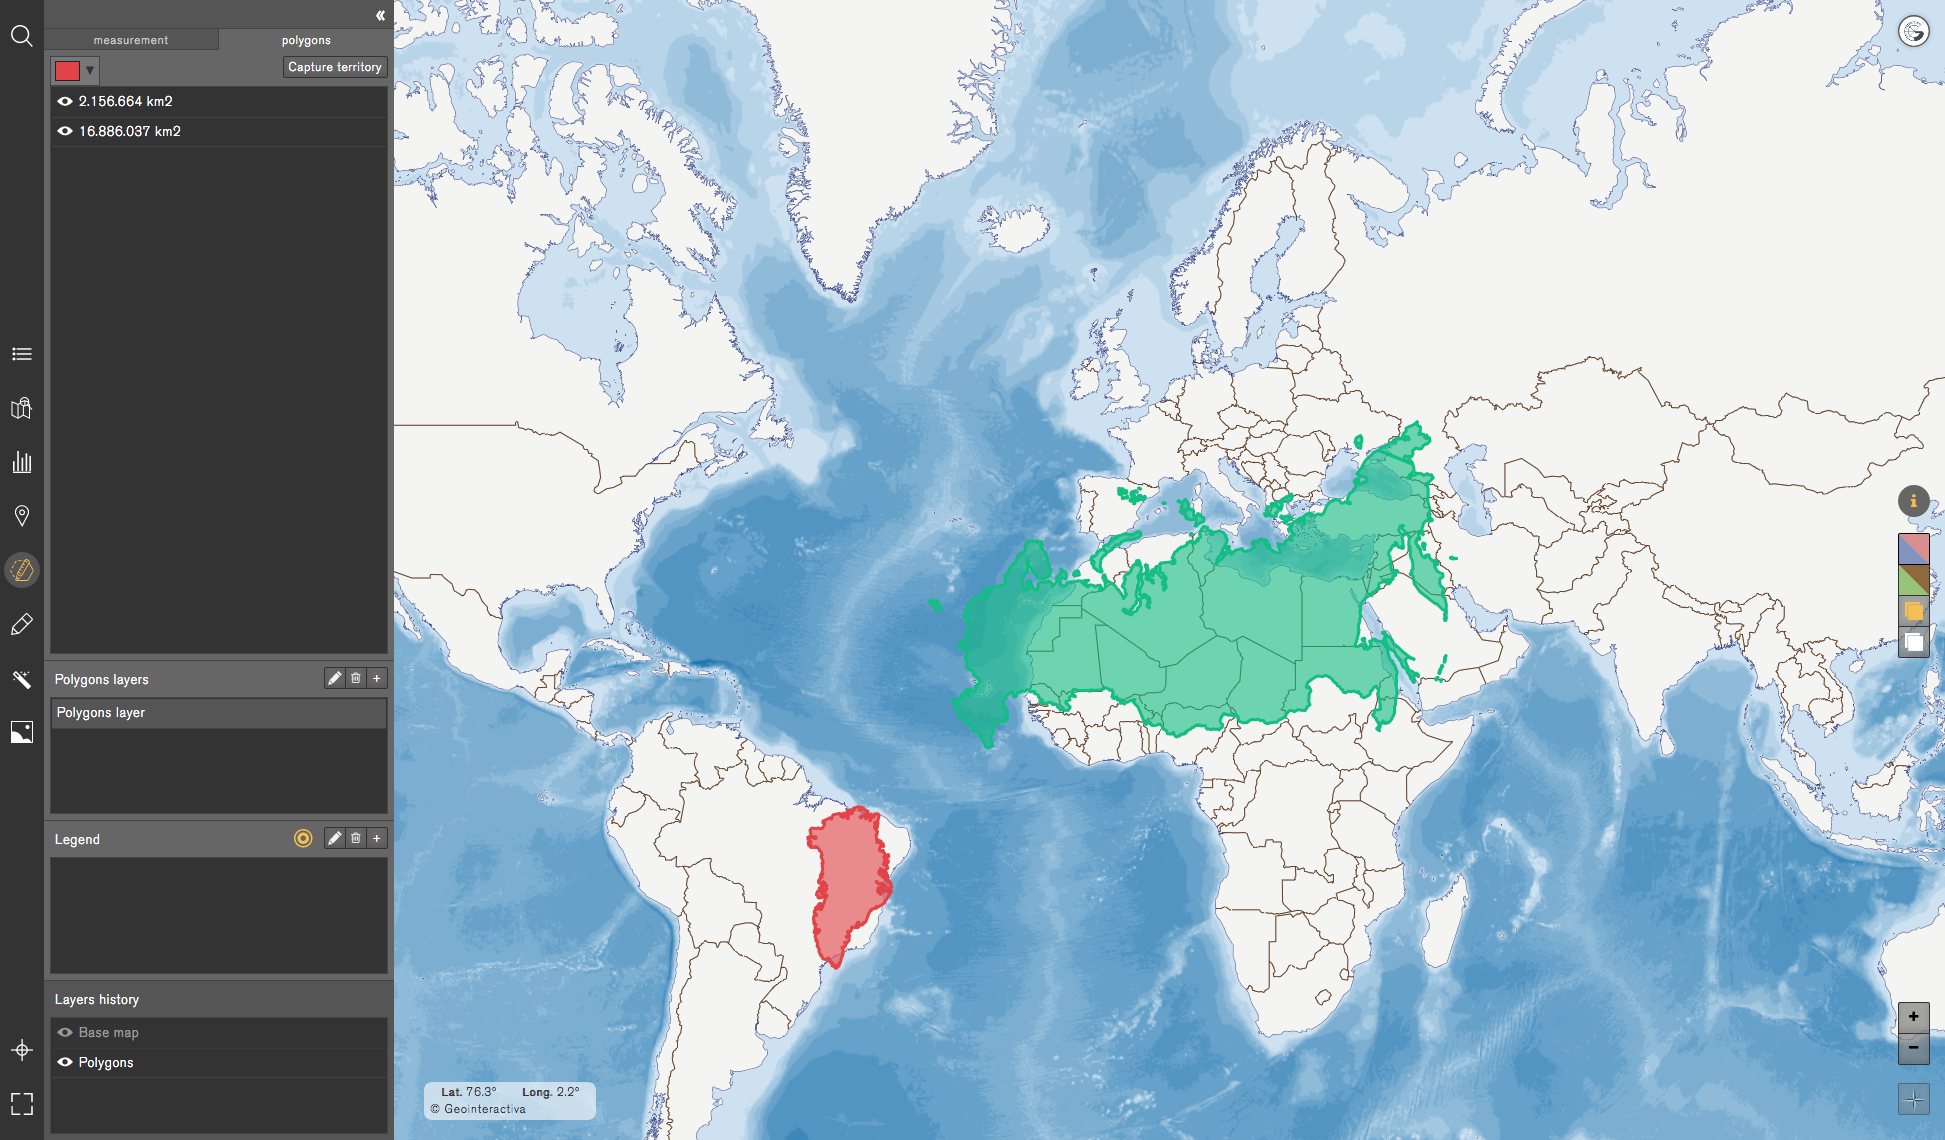
As shown in the example, the surface of a country, in this case Greenland, increases or decreases with respect to its latitude of origin, responding to the map projection. In this way, we can know the actual size of the countries by comparing their surface. This tool also helps to visually recognize the shape of each country.
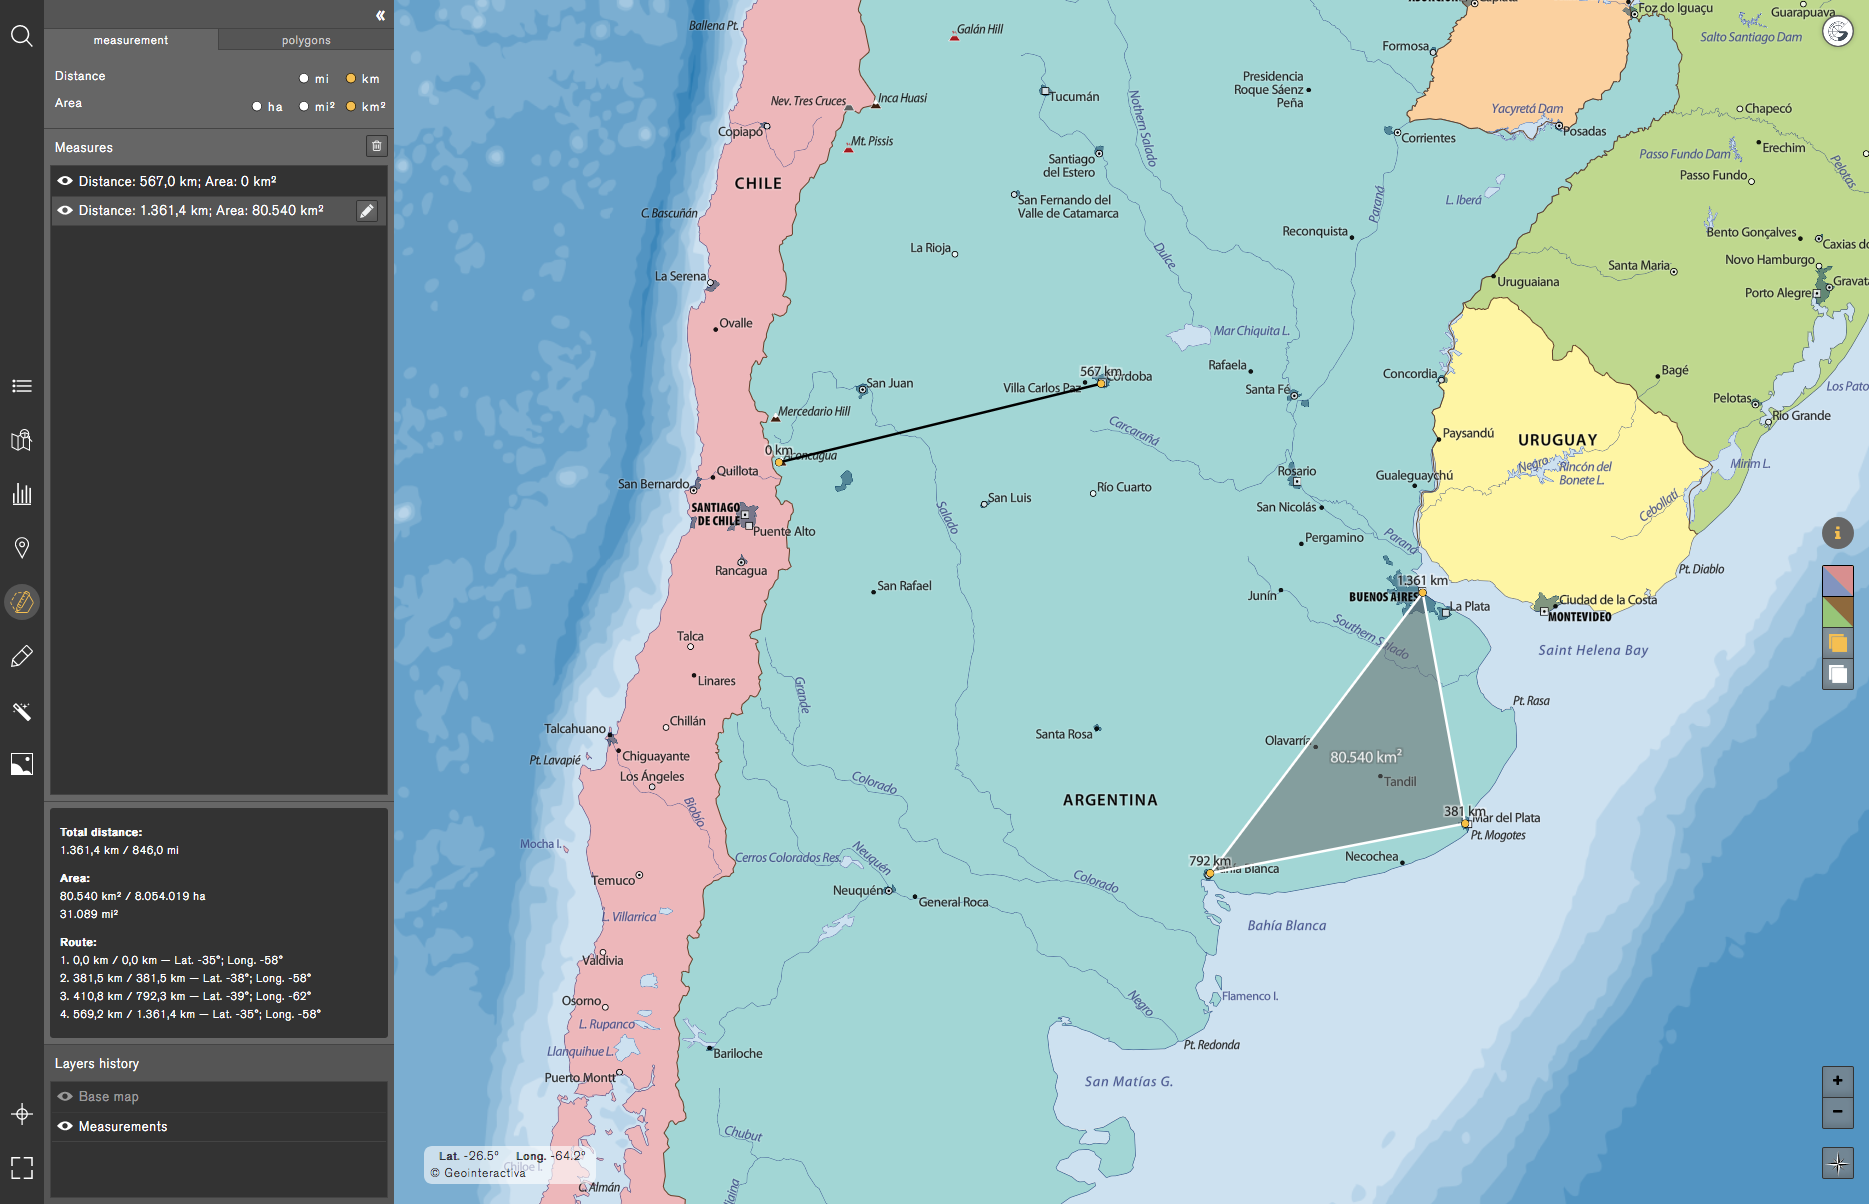
Measurement of distances on the map
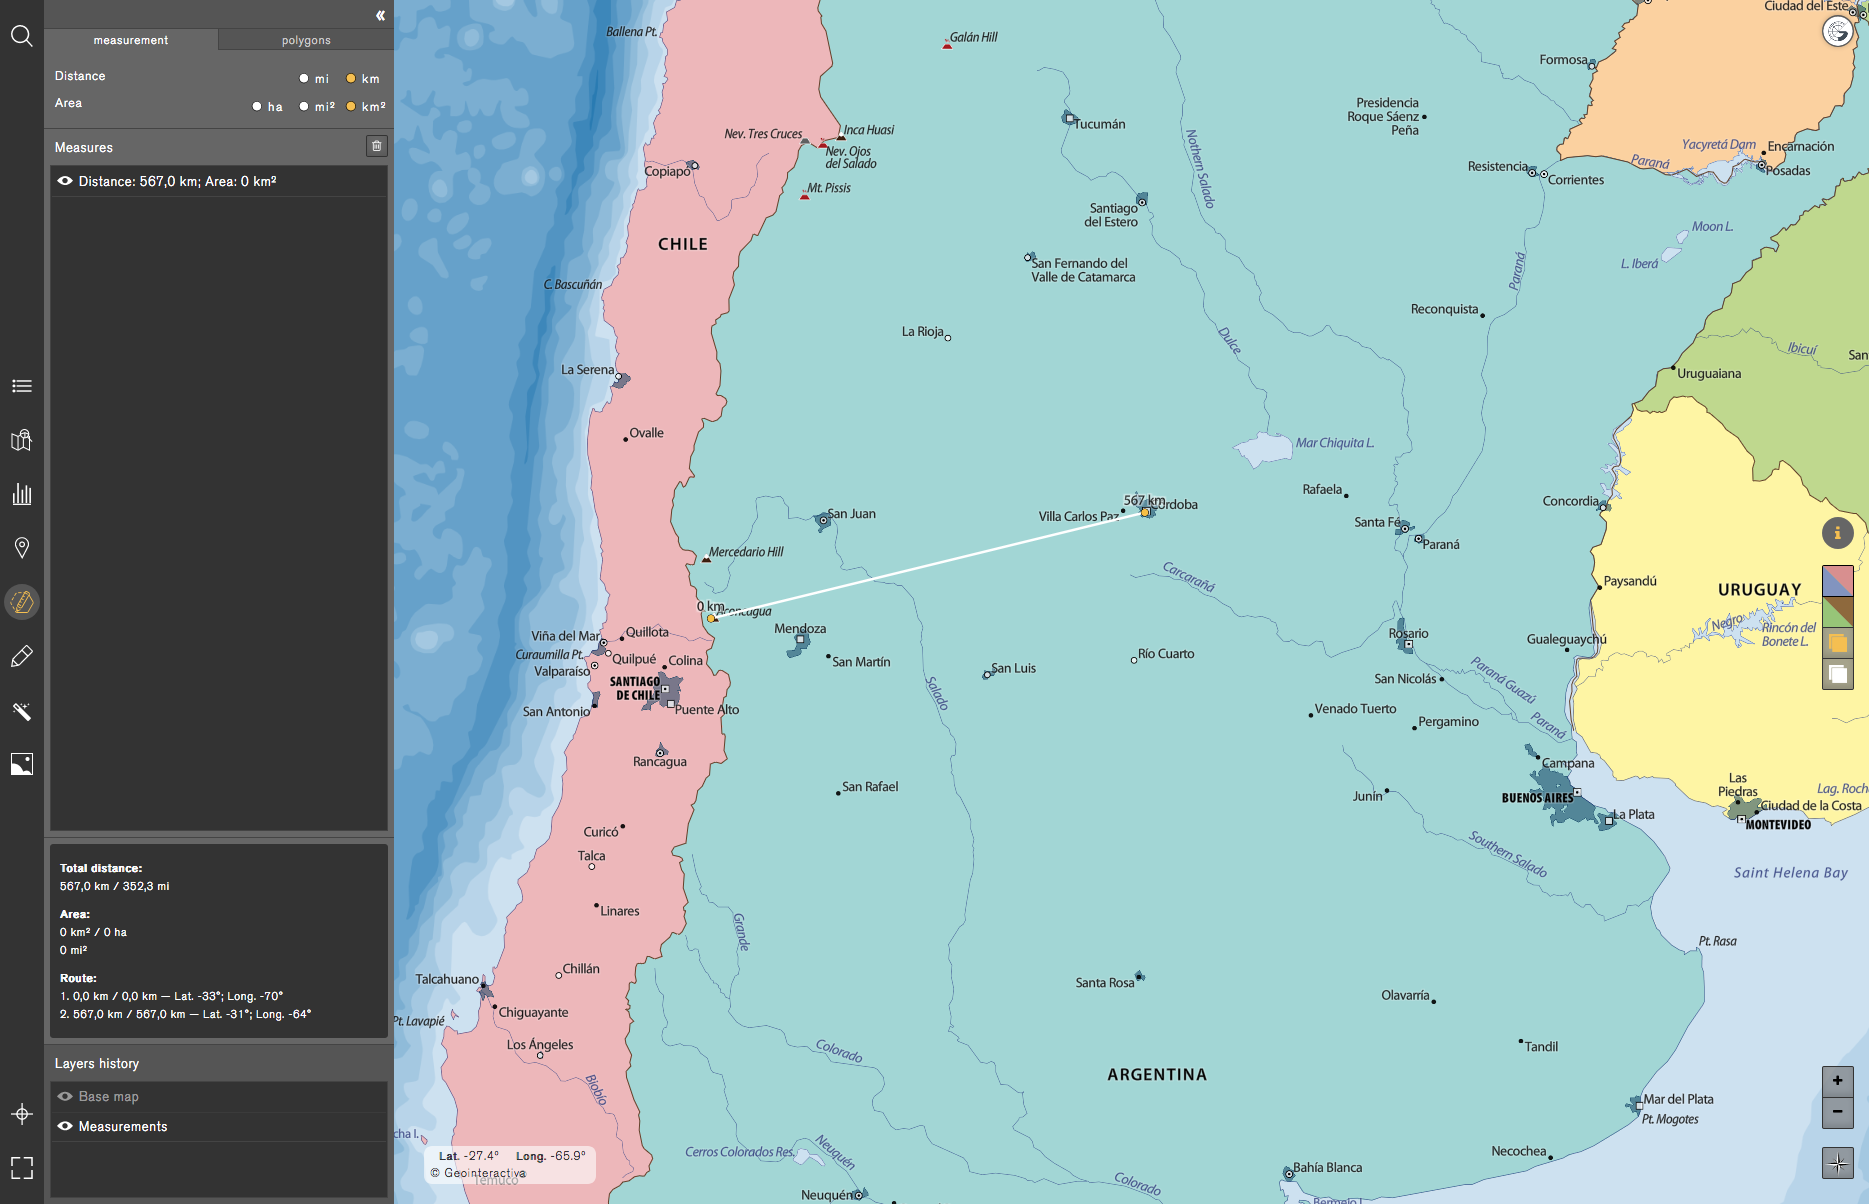
The Measurement tool allows to measure distances by means of lines or polygons. With every click we make on the map we generate a new point that will be reflected in the Tool Menu.
Activity 1Calculating the distance between the mount Aconcagua and the city of Cordova.
Once we have started the measurement by adding the first point(mount Aconcagua) and the second one (city of Cordova), we nextly doble click on the last point to create the segment.
As soon as the measurement is finished, in the low part of the Tool Menu all the specific information will appear.
Activity 2Create a polygon that unifies three cities: Buenos Aires, Mar del Plata and Bahia Blanca. The polygon will be automatically generated when the user joins the last point with the first one. Every generated measurement is displayed in its corresponding menu. At the menu will appear the record all lines and polygons created by the user.
We can also measure distances by combining various elements depicted in the map: towns, peaks, headlands, points, gulfs, islands, rivers, mountains, valleys, etc.
Activity 3 Calculate the scale of a map by creating one or more segments with their respective lengths. We will determine the scale of the map by printing it first to scale 100%. We will next measure with a rule the segment that we have drawn, making the conversion (rule of three) between the measured units on the map (in centimeters), and the measure indicated by the measuring tool (in kilometers or miles).
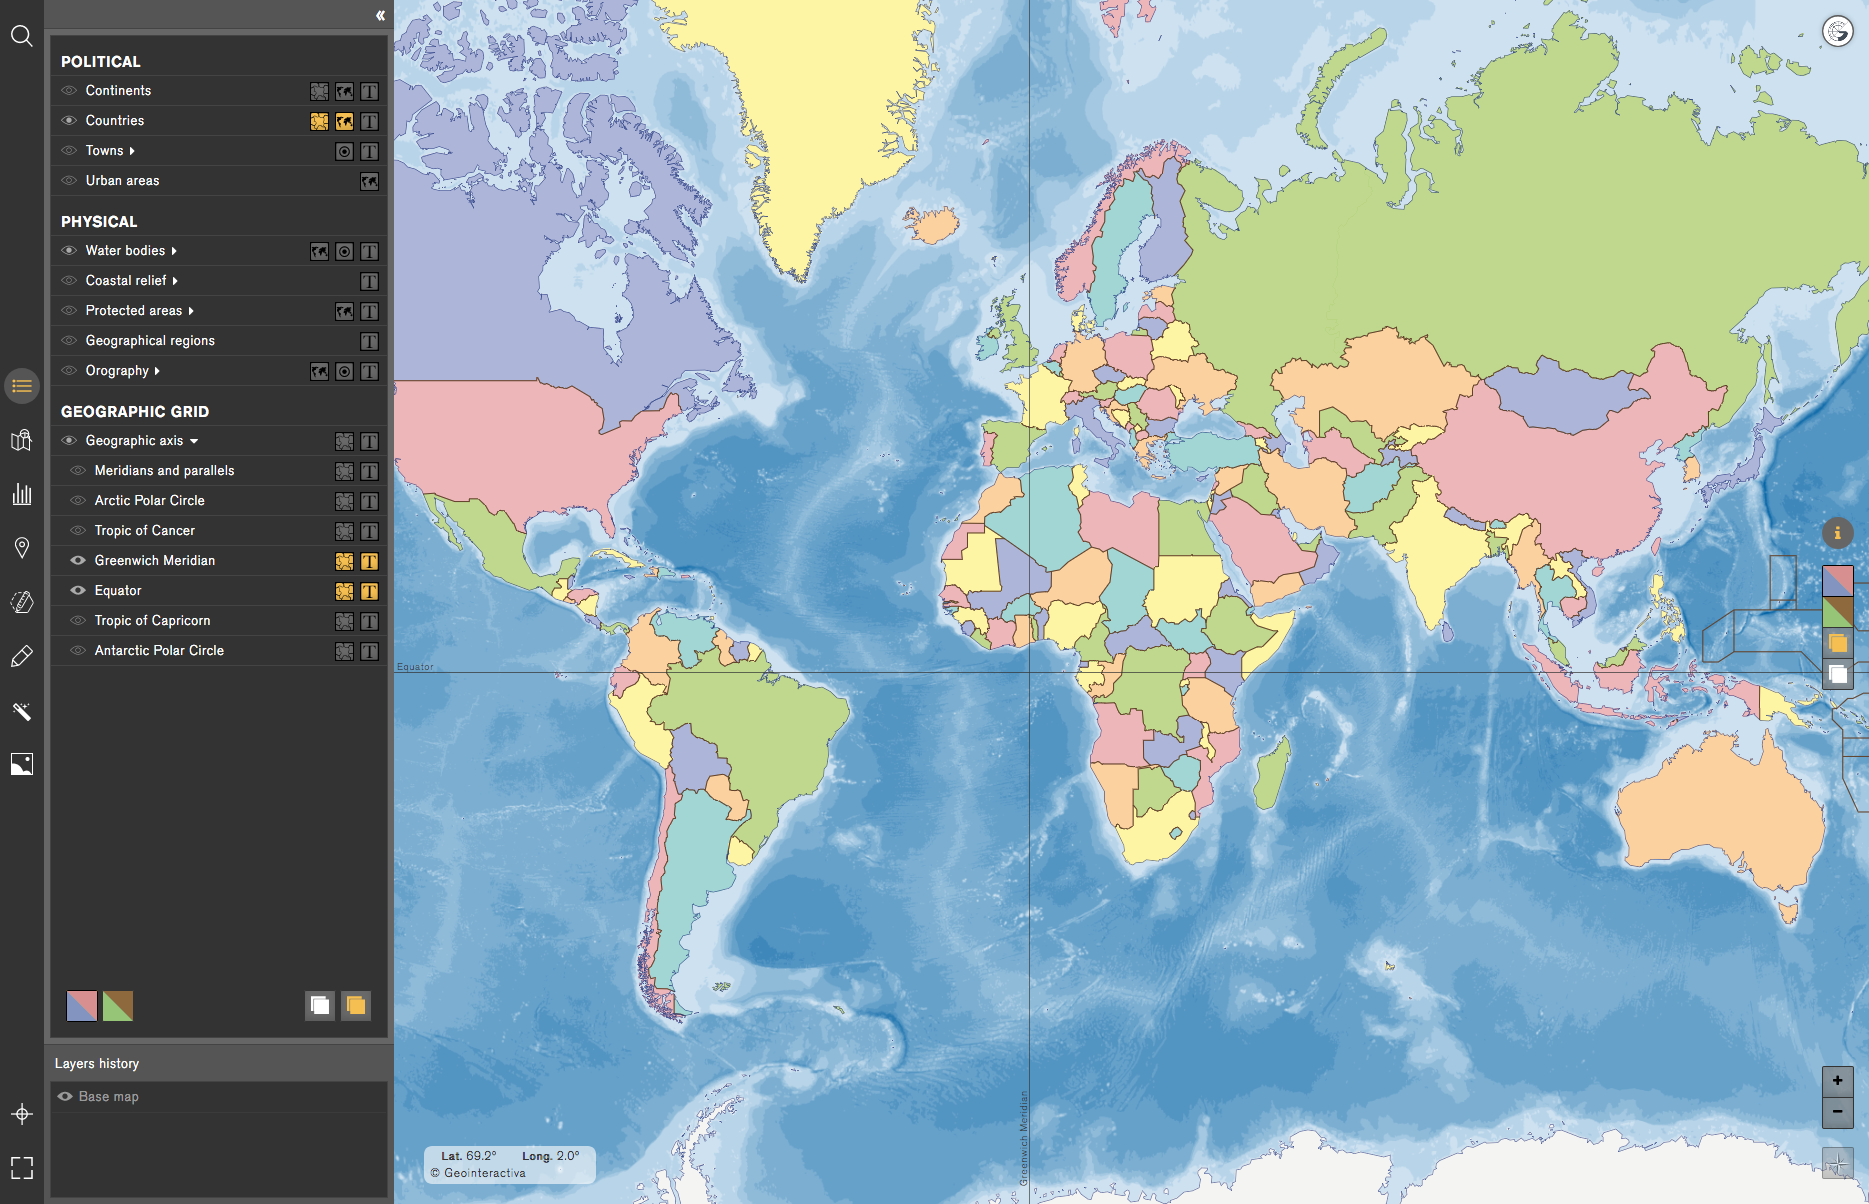
Orient yourself in the territory
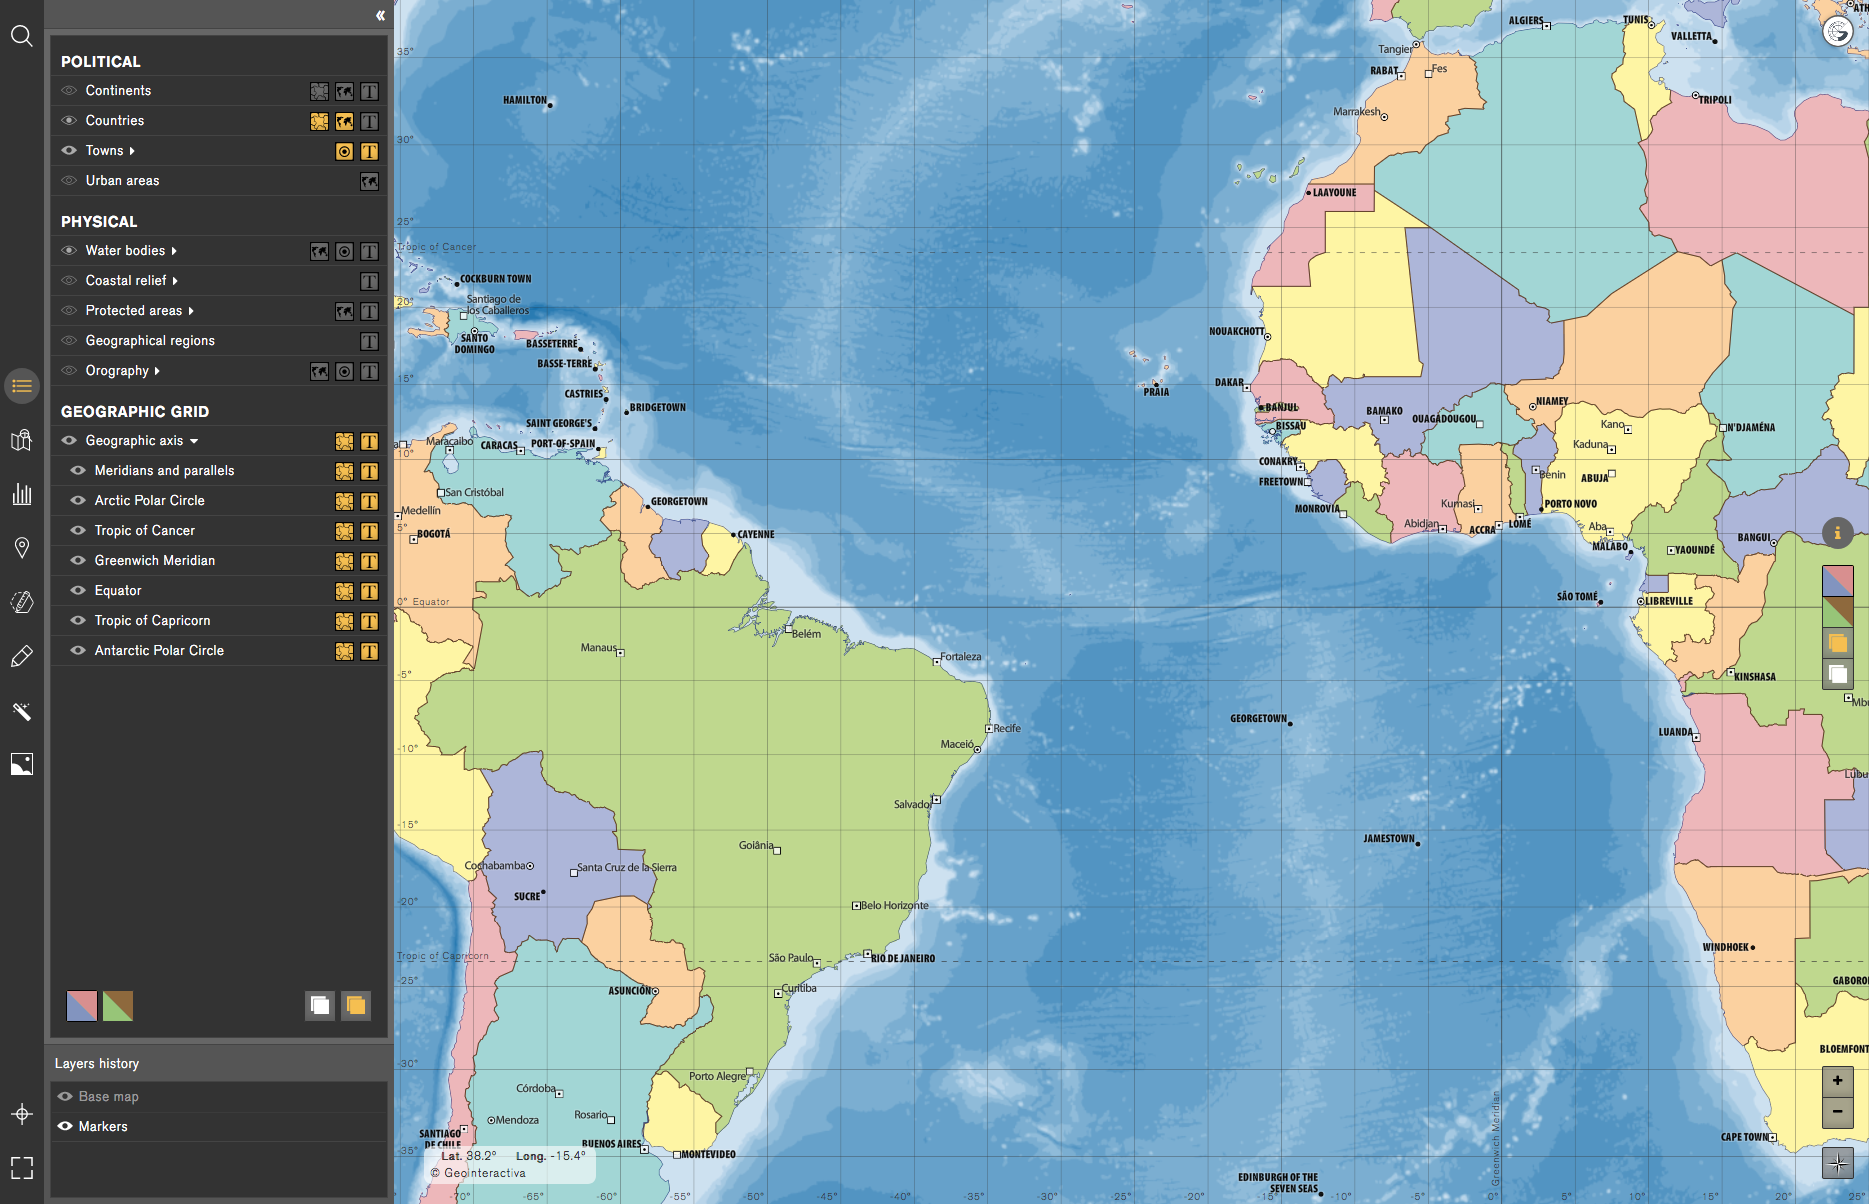
ActivityFamiliarize yourself with the cardinal points (North, South, East and West) and learn where to place them in respect of the geographical location from any place on the map.
We can do it by displaying the layer of a geographical axis: the Equator parallel and the Greenwich meridian (selected in the image).
The entire area above the equator will correspond to the northern hemisphere, and the line below will correspond to the southern hemisphere. The same goes for the Greenwich meridian; the area on the left of this meridian will correspond to the western hemisphere, and the area on your right will correspond to the eastern hemisphere.
Determination of the terrestrial altitude or the marine depth
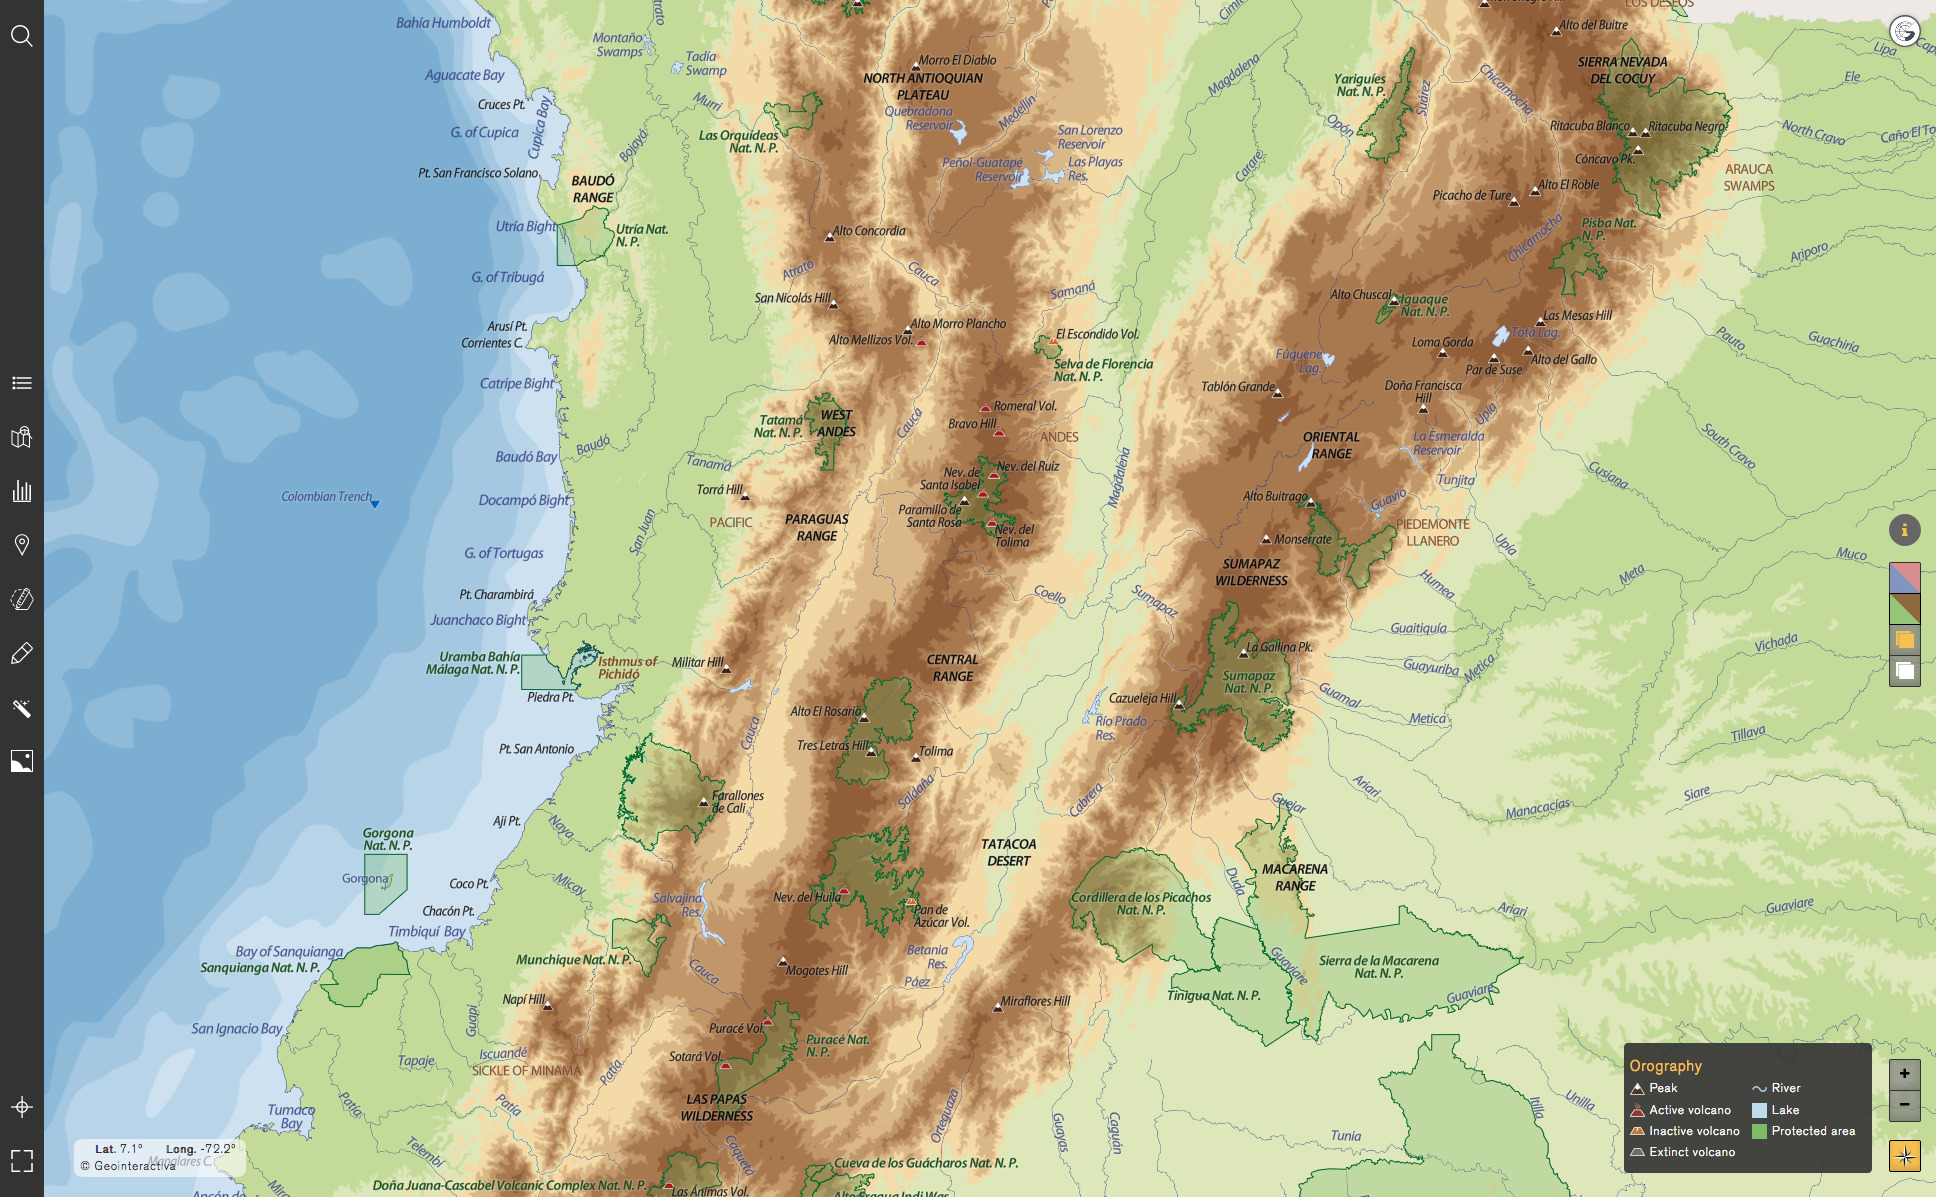
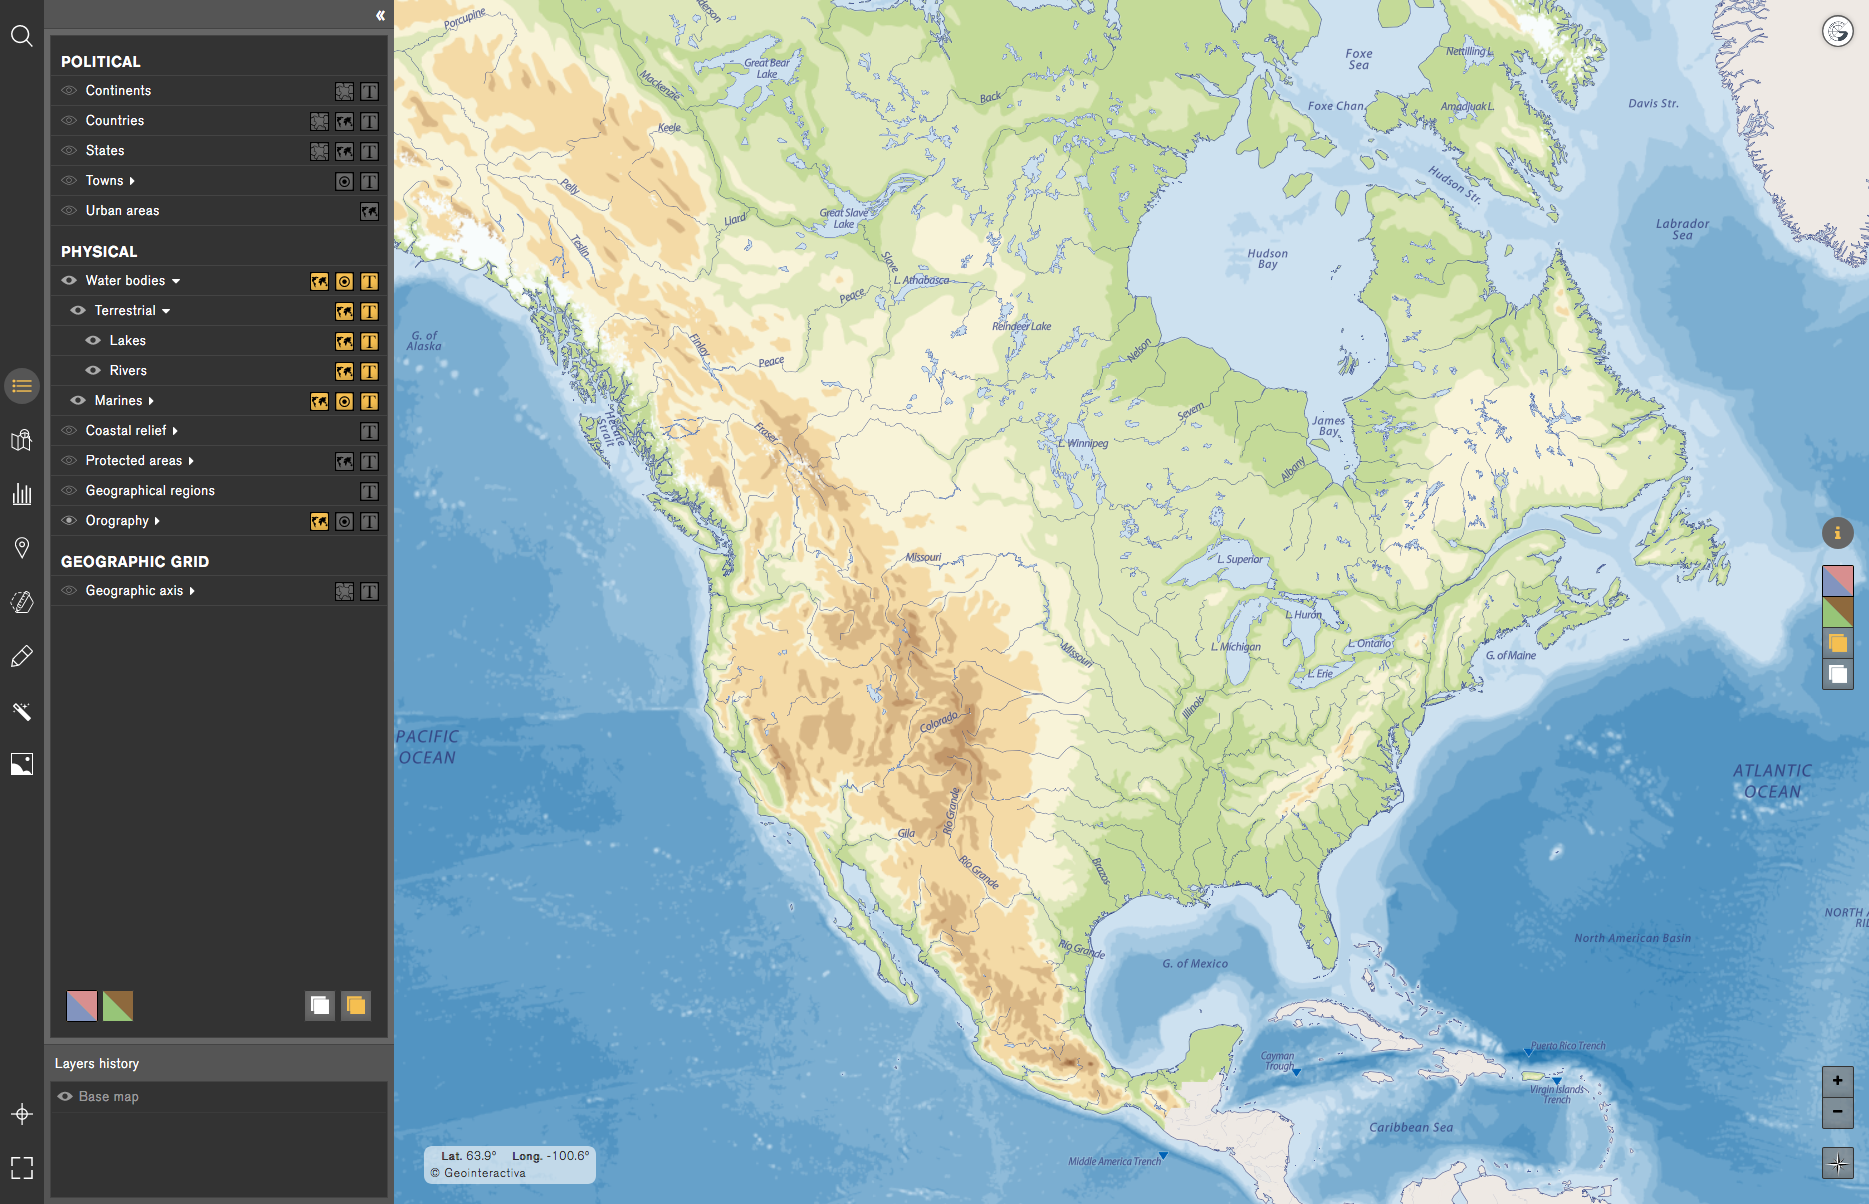
Activity 1Identify the altitude range of any point on the Earth's surface using the information of the different hypsometric levels represented in the physical maps, as well as locating the main peaks, or those large physiographic units of a specific territory, by activating the Peak layer or mountain belt.
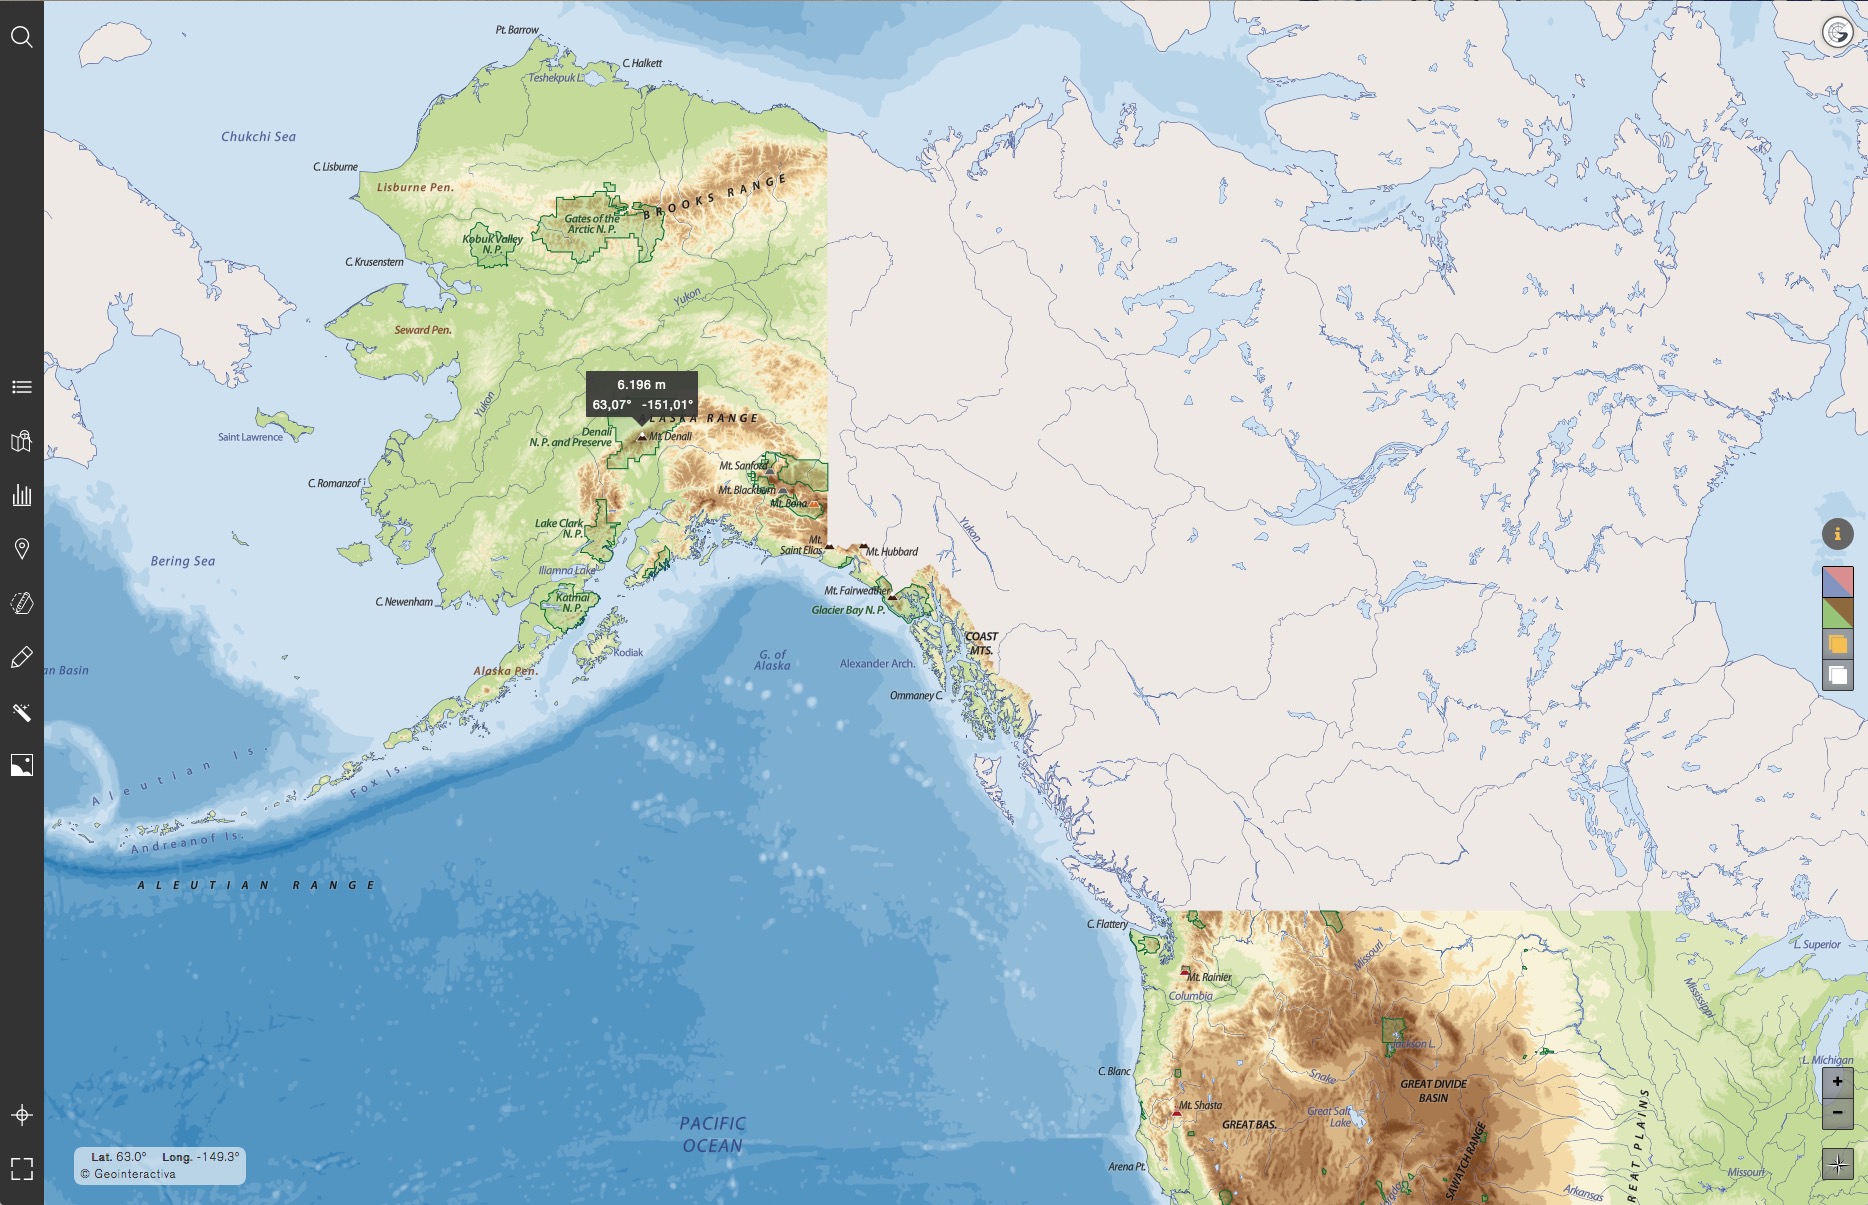
With the help of the hypsometry, the physiographic units, and the hydrography, we are going to recognize the topographical form of a territory discovering and trying to guess the areas of jungle, savannah, intensive cultivation, mining or oil extraction, etc.
Activity 2By using the information of the different bathymetric levels represented in the physical maps, we will try to identify the depth range of any point located in a marine depth, as well as identifying the main marine pits activating the corresponding layer.
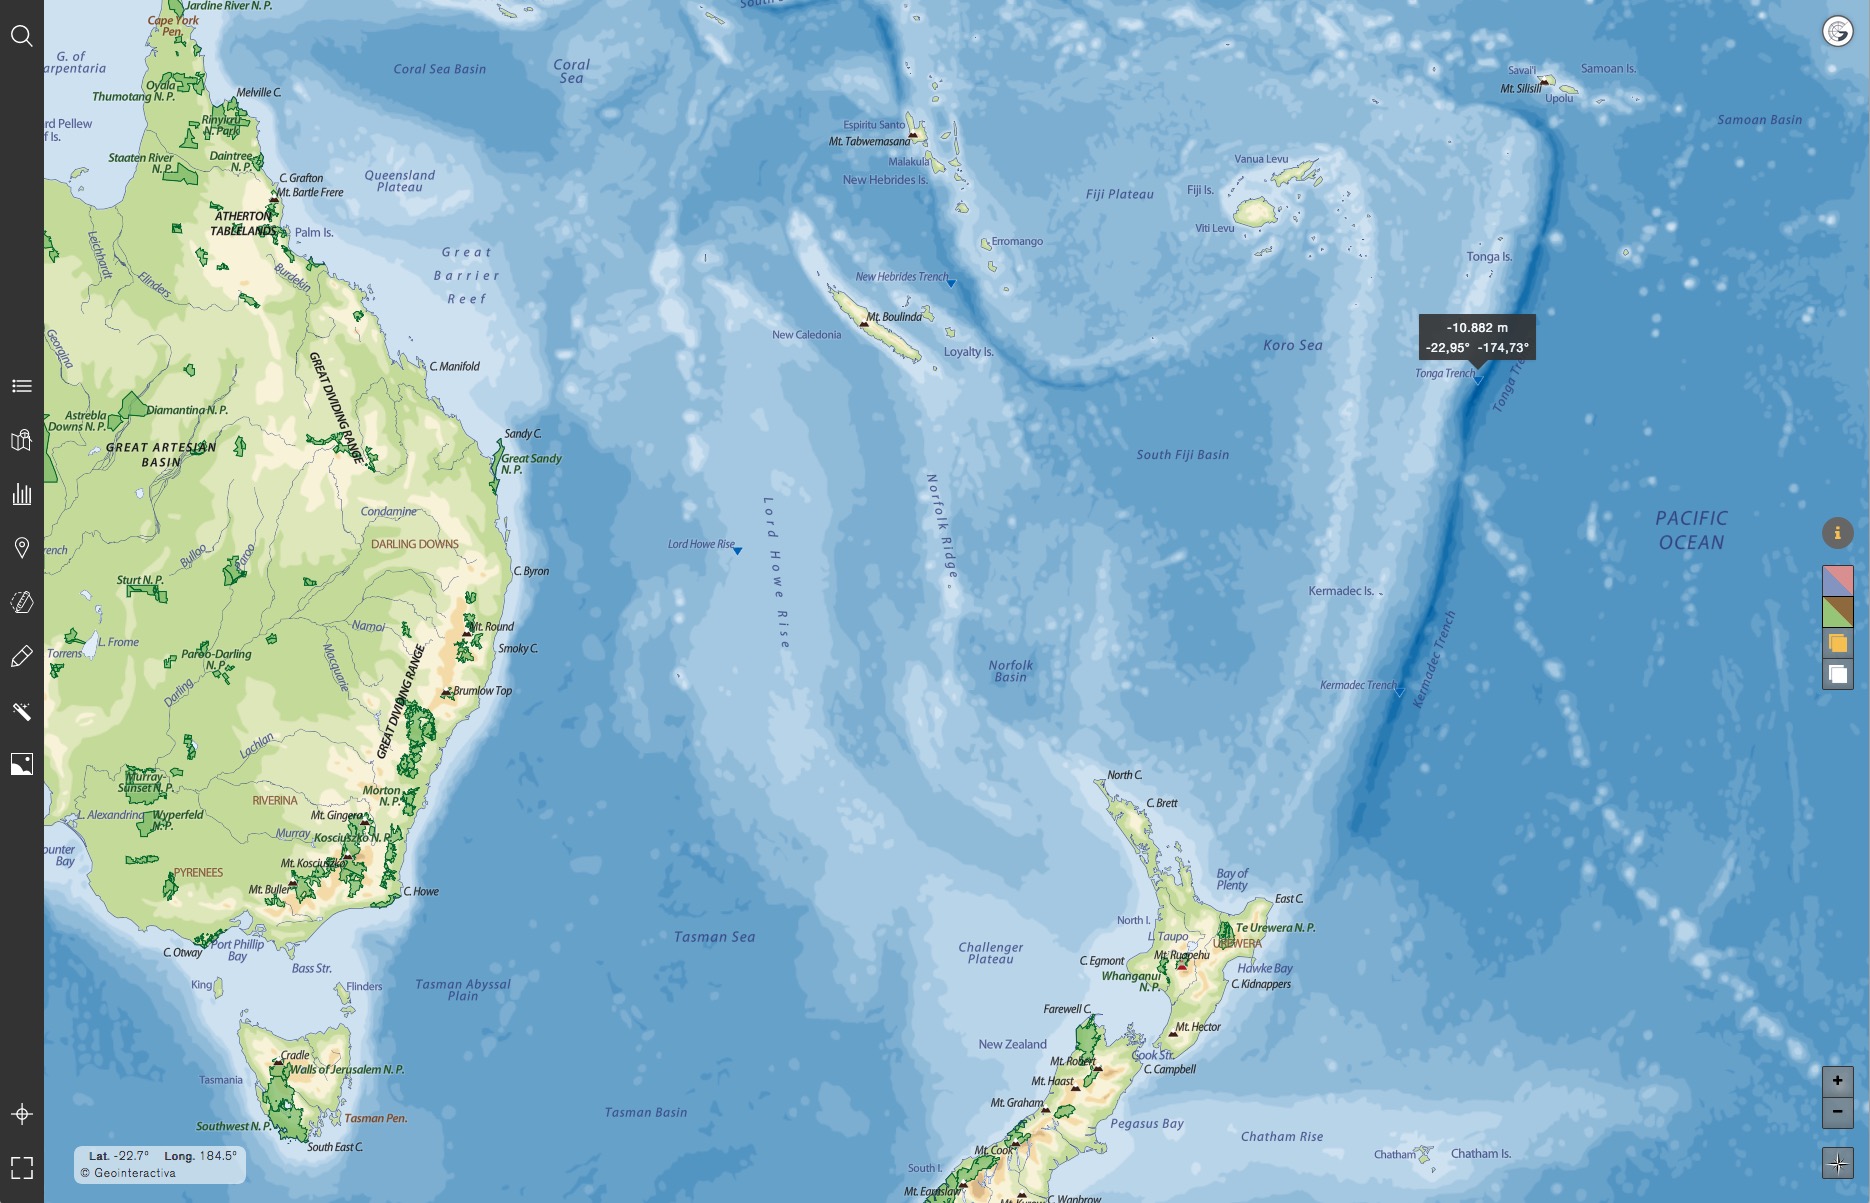
By understanding the use of the bathymetry, we will observe and propose, depending on the areas of greater depth, the possible navigable areas, seaports or potential fishing banks of seas and oceans.
In order to determine where the most extreme meteorological conditions of a particular place can be given, based on its geographical location, we will study its altitude and the characteristics of a topographical relief.
Identification of the main water bodies
ActivityThe Water Masses layer from the Layer menu, allows to individually activate the different sublayers that compose it; hide or show depressions, lakes and rivers, oceans, seas, gulfs and bays. In this menu layers can be activated according to the elements that compose it: text, point and image. So, if we want to study the main river courses and lakes in North America, we will have to select the map in question and activate the corresponding layers.
We will also be be able to learn the headwaters of the rivers according to their source, either snowy (from the melting of the snow accumulated in a mountain) or pluvial, with the combination of the Water masses layers and the Mountain systems layer. By observing the course of the rivers, we can determine their headwater source, their mouth, as well as their affluents, and determine the density of the hydrographic network of a certain region (number of watercourses divided by the surface of a certain territory).
Identification of the main urban areas
By activating the Urban areas layer we can understand the degree of urban concentration of the populations of a country, zone or region. This layer allows the user to display, and quickly recognize, the main urban agglomerations. Within the Information tool, in the Criteria section, it is specified the minimum area of the urban areas shown on the map where we are located.
Activity 1Identification of the urban areas according to the symbol of the populations: We will first clean all the layers and activate only the population ones. Then we display the Legend (located at the bottom right) to know the population range that determines each symbol. Note that, by going over a toponym with the mouse, this action will display the specific population of the toponym itself. From here, the student will have to recognize the most inhabited populations and understand where are located those main urban areas.
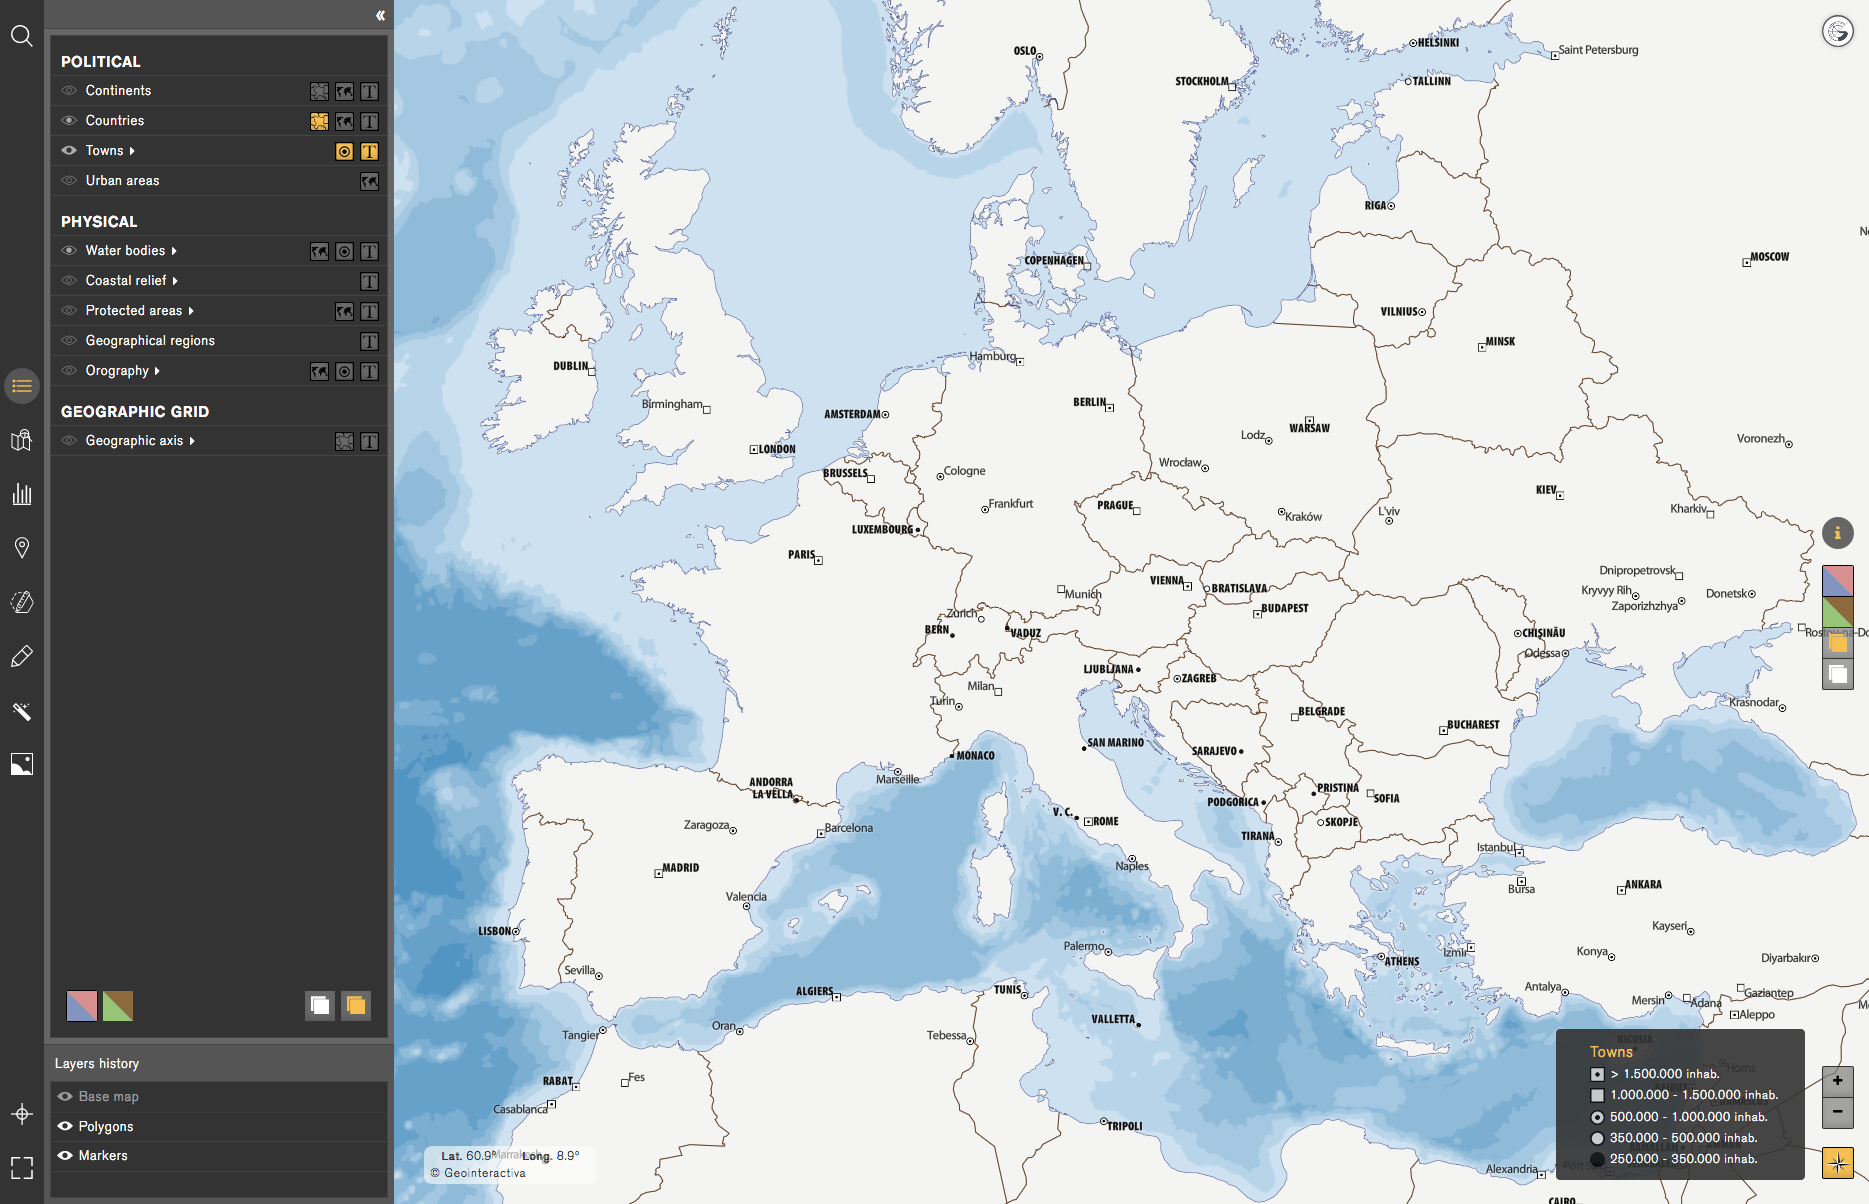
Activity 2By activating, as in the previous activity, the Populations layer and the Urban areas layer, we will observe how the main populations correspond to urban areas. If, in any case, we observe a significant population without an urban area, it is because that area doesn’t correspond to the chosen criteria to compose the map. In the case of the map of Europe, for example, urban areas appear with a minimum extension of 100km2.

Exercises with the toponymy
Identification of the ranges of the population and administrative
Those layers within the Layers menu will adapt to each map in relation to their content. If we want to learn the capitals of the countries, we can do so from the World map as well as with any of the continental maps.
These maps present a subdivision in the Population layer that allows us to select individually the Capitals, or even select all the populations.
Activity 1Learn the capitals of each country: Choose the world map and deactivate all layers. Then activate the Countries layer and the sublayer Capital of country within the Populations layer. In order to learn the Capitals we can do so by activating and clearing these two layers.
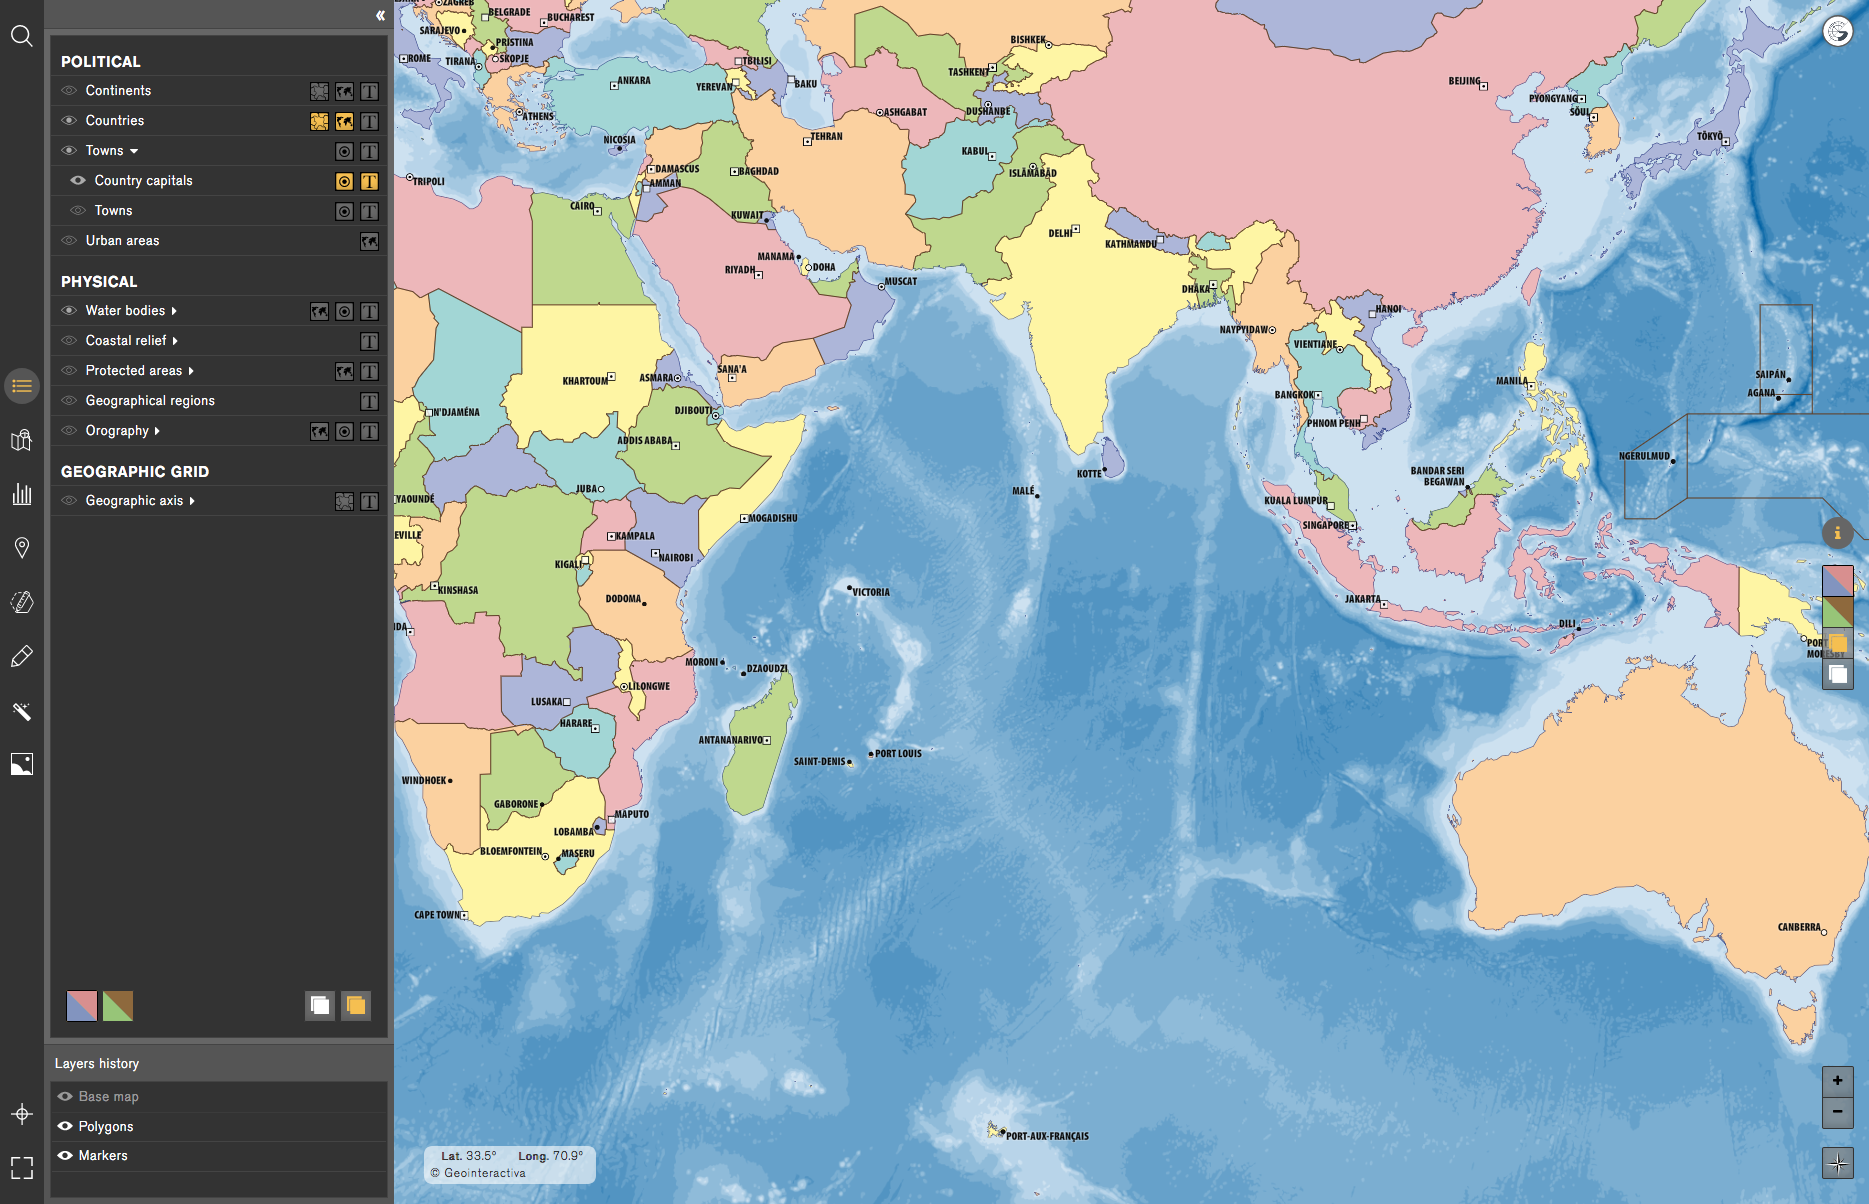
In addition, we can also learn the capitals of the different administrative units in each country (state, province, region, district or municipality) with the maps at a national level. This action will allow us to recognize the names of the populations (toponyms) and their hierarchical organization as an administrative approach. In the case of France, the Populations layer distinguishes between Capital of country, region and department.
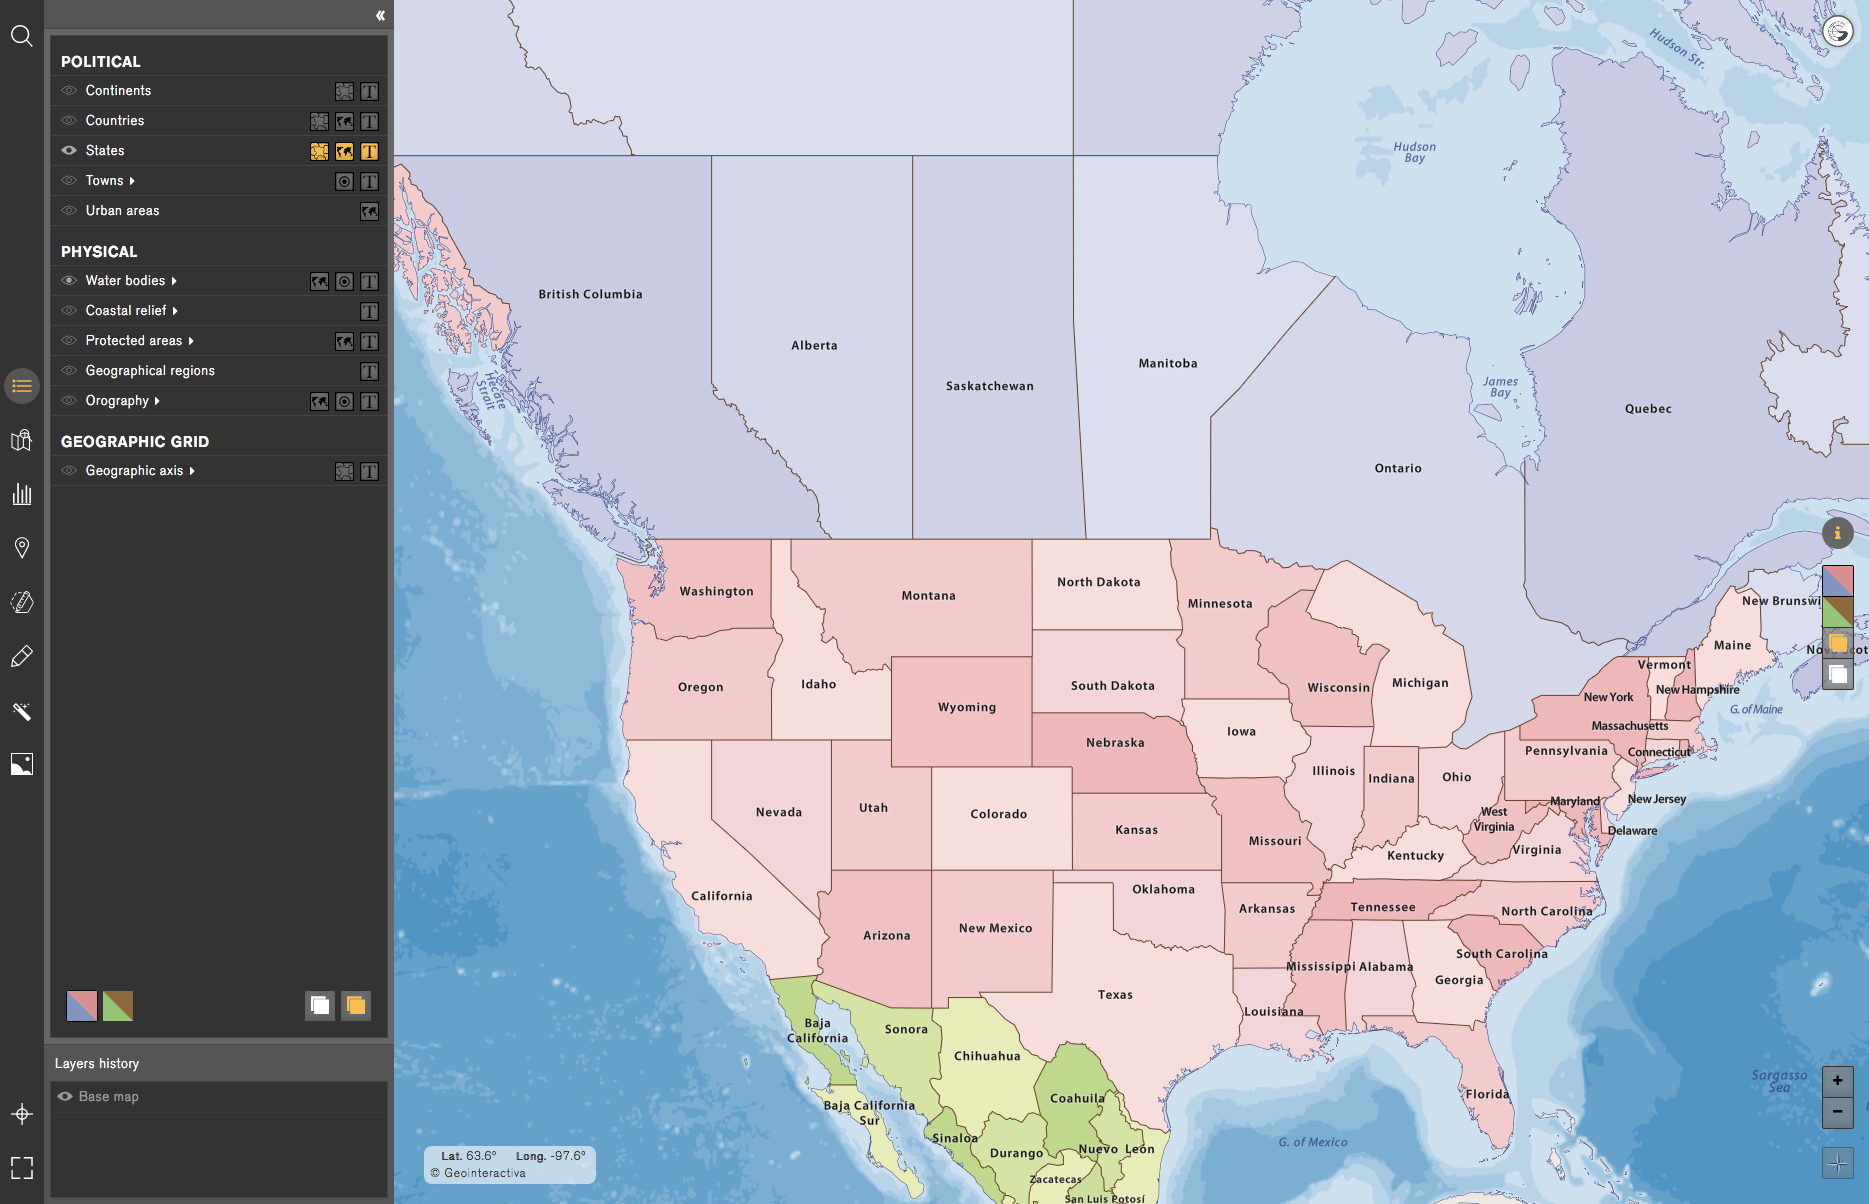
Activity 2Learning the names of the States: In order to learn the names of the States we will situate ourselves in the map of North America, where we can see displayed in the layers menu that appears the States layer and also the State Capitals layer.
We will proceed in the same way as in the previous activity, enabling and disabling of the corresponding layers to learn, step by step, the content in which we are interested.
Technical Data Sheets
Activity 1By clicking the name of a country a technical sheet will be displayed with information on the country itself. We can open multiple technical data sheets to perform a quick comparison between them. These technical data sheets contain physical and political data, socio-economic aspects, among others of a general interest.
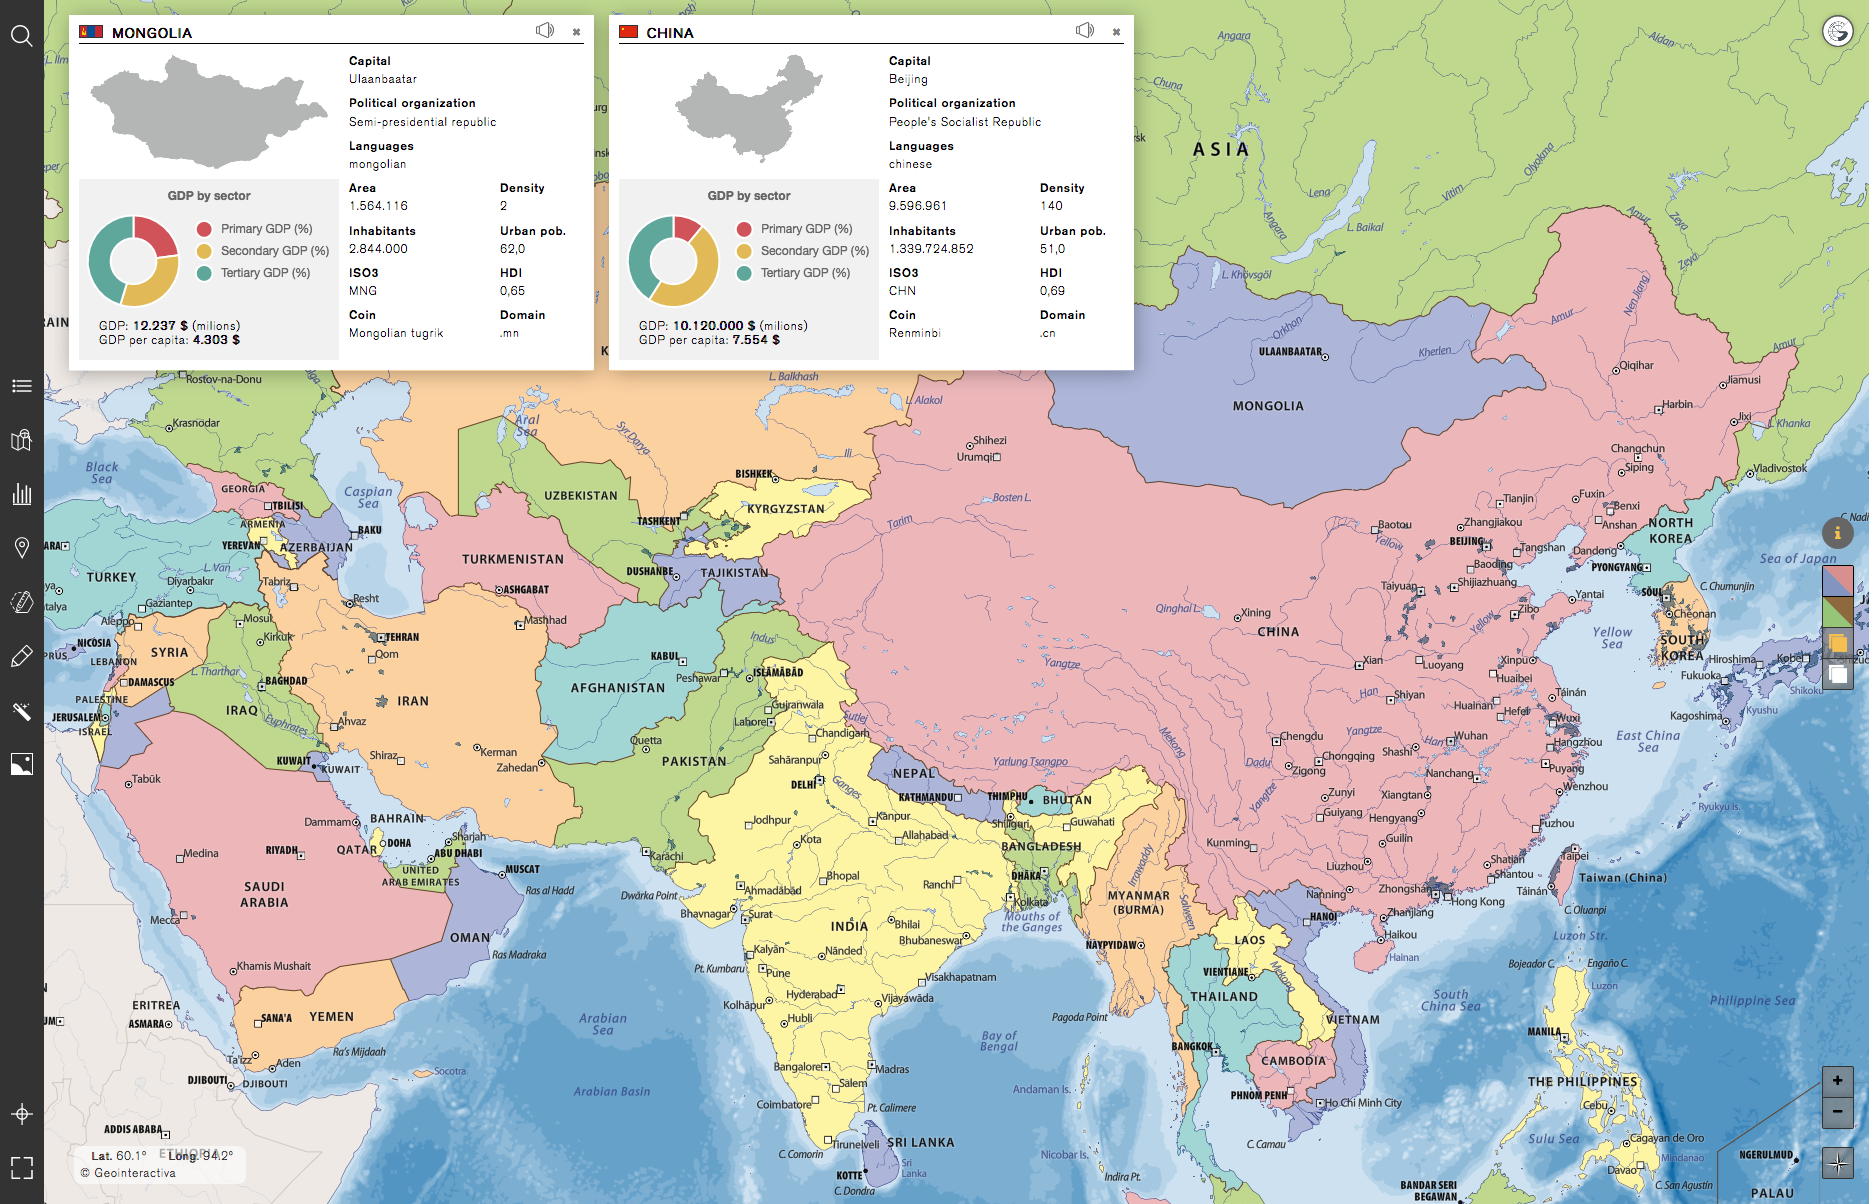
The Geointeractiva team is now working to incorporate a function that will allow the user to create technical data sheets, or even being able to edit the already existing ones. This way, the user will be able to have technical data sheets for all those elements that he wants, whereas now they are available only for the countries.
Geolocalisation and enhancement of contents with Markers
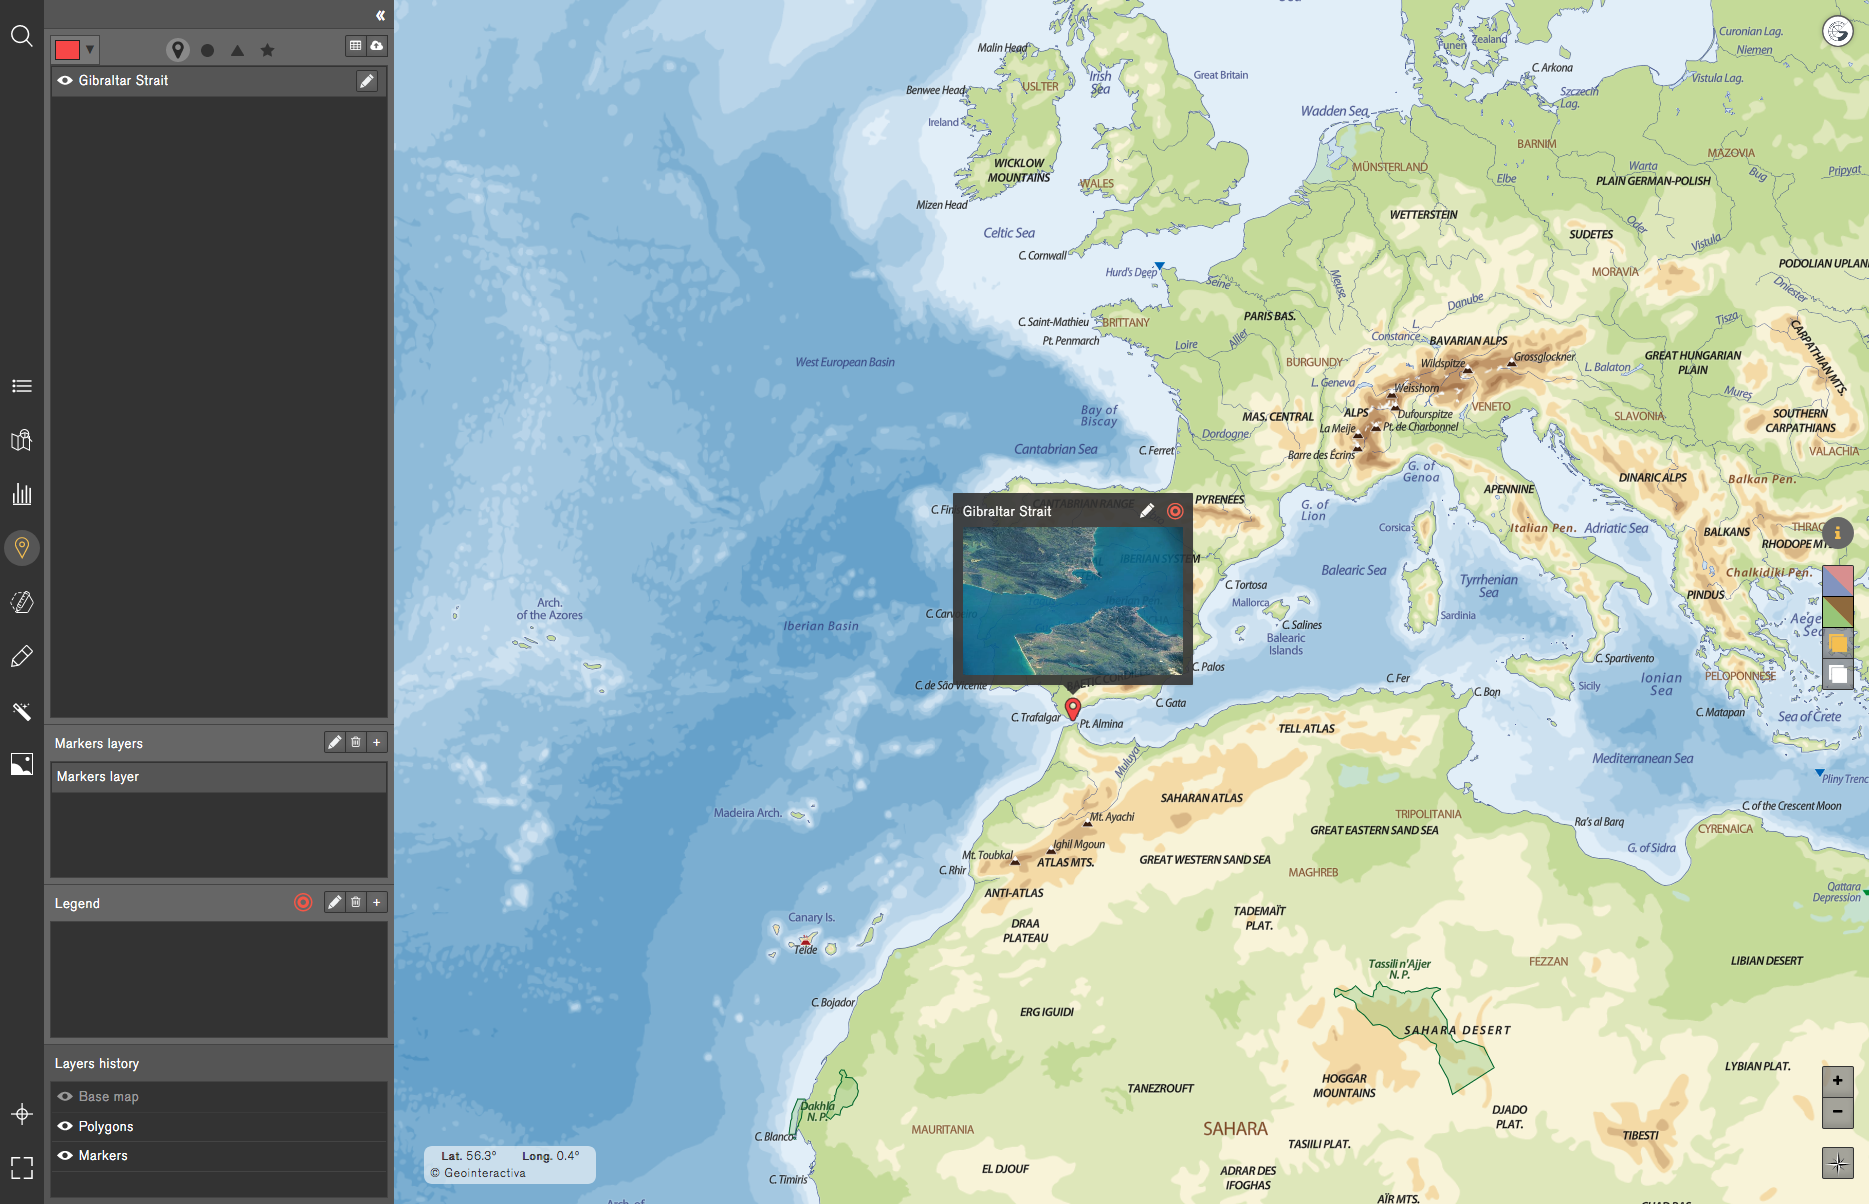
Maps can also be enhanced and customized by adding personal multimedia elements using the Markers tool (either by the individual work of each student or through the collective work done by the class group). Embed from your computer or from the Internet: Illustrations, photographs, statistical charts, mental and conceptual maps, videos, hypertext associated with references of articles or encyclopedic contents, etc.
ActivityWe will start by selecting the Markers tool to perform this exercise. Before creating a Marker, we can choose the icon that represents it as well as its color. Next, we click where we want to place the marker to create it (we can also move it later or modify the coordinates for even greater accuracy). Once created, we add our wished content; image, text, video, audio, etc. In this next case, we have placed a marker in the Strait of Gibraltar and we have added an aerial image of the strait, as well as a brief description.
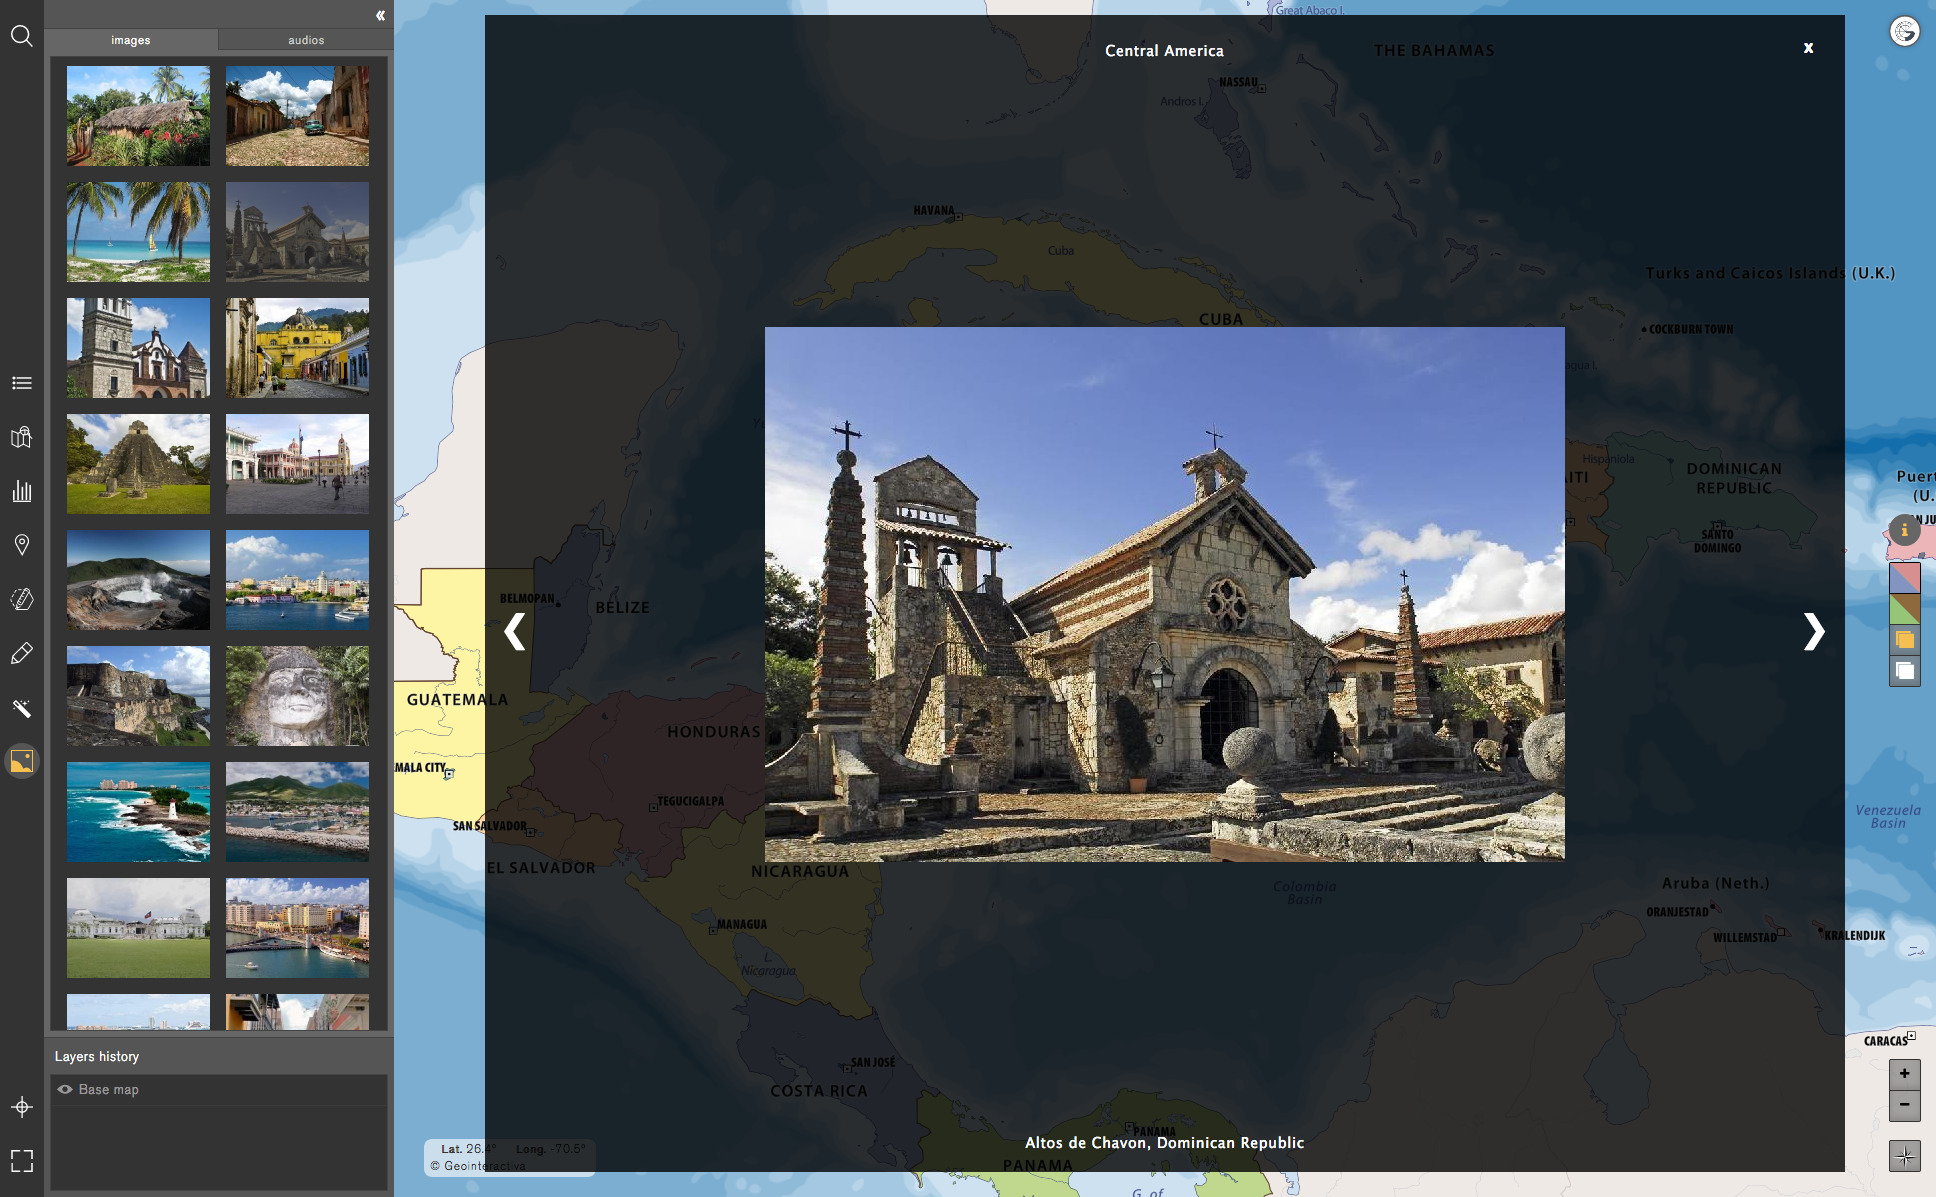
Exercises with pictures
With the Multimedia tool users can upload and organize their own files (image, audio or video), and complement the information of the map. Geointeractiva also offers multimedia content included in all subscriptions.
We highlight the following exercises as an example:
Activity 1
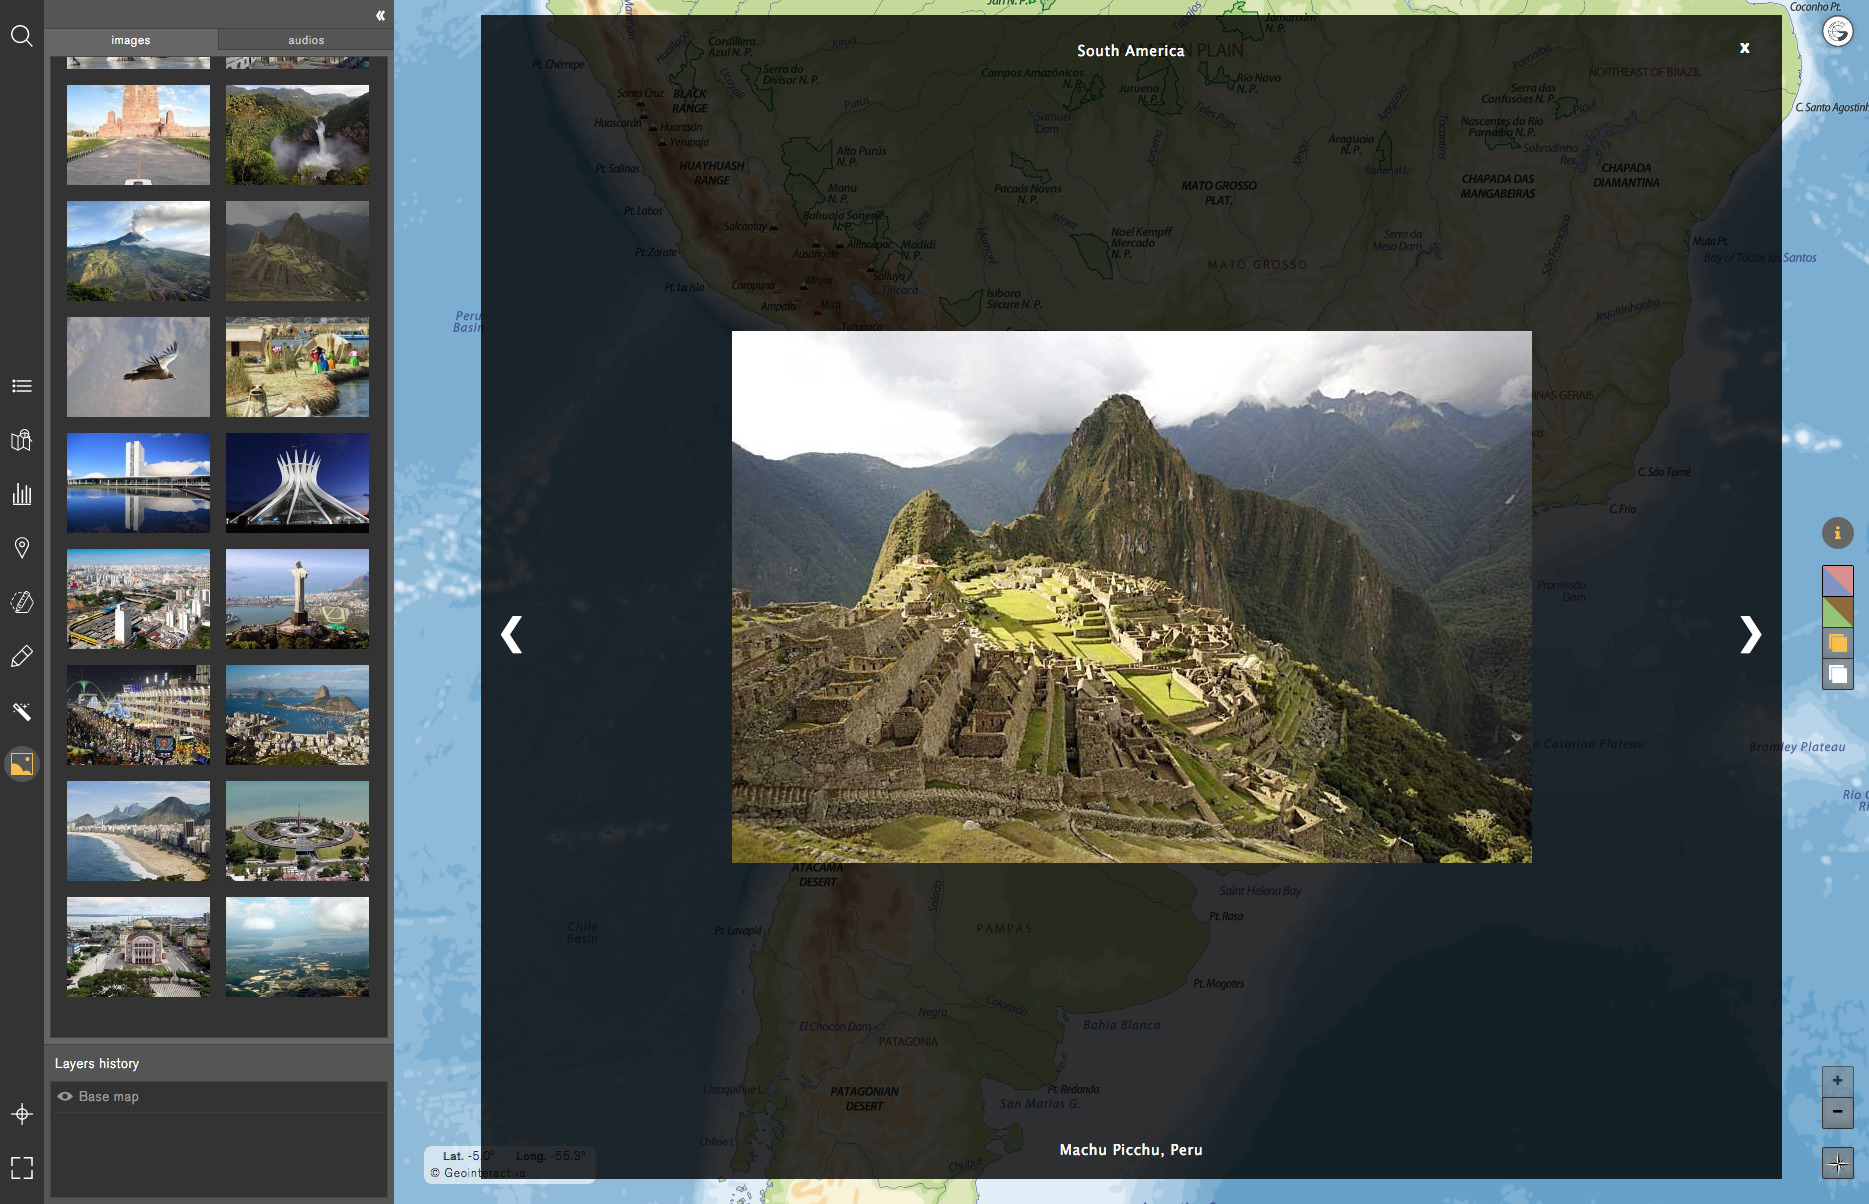
Identify, through the photographs, the most important enclaves of a country, a region or a place and understand how to recognize in which region of the world it is located. In the same way that the photographic contents of Geointeractiva are grouped by continents, the user can also create his own categories to distribute the uploaded content. This activity can also be considered to emerge transversal practices in various subjects as in geography, history, art, urbanism, among others.
Activity 2
Add descriptions and titles to media files in order to identify how a particular enclave is correctly written, or to remark the essential characteristics of a place of interest. This activity can also be considered as a transversal exercise of knowledge of the language (or languages) of a country or, as well as foreign languages.
Activity 3
To establish a synchronous comparison (through the times) of the enclaves and monuments shown in the current images from past eras. To do this, the user should locate old photographs of these enclaves, and upload them in the Multimedia space. The user can thus compare the evolution and those significant changes through the times.
Activity 4
Proposing the students for an oral or written presentation of the graphic and geographical information contained in each photograph, and the evocations that may suggest. This activity can also be considered as a transversal writing exercise, literary composition or even oral expression.
Activity 5
Associating photographs with an audio content of songs that identify a showed place or ethnic region of the map. This activity can also be considered as an exercise with music for transversal teaching methods.
Activities with Statistics
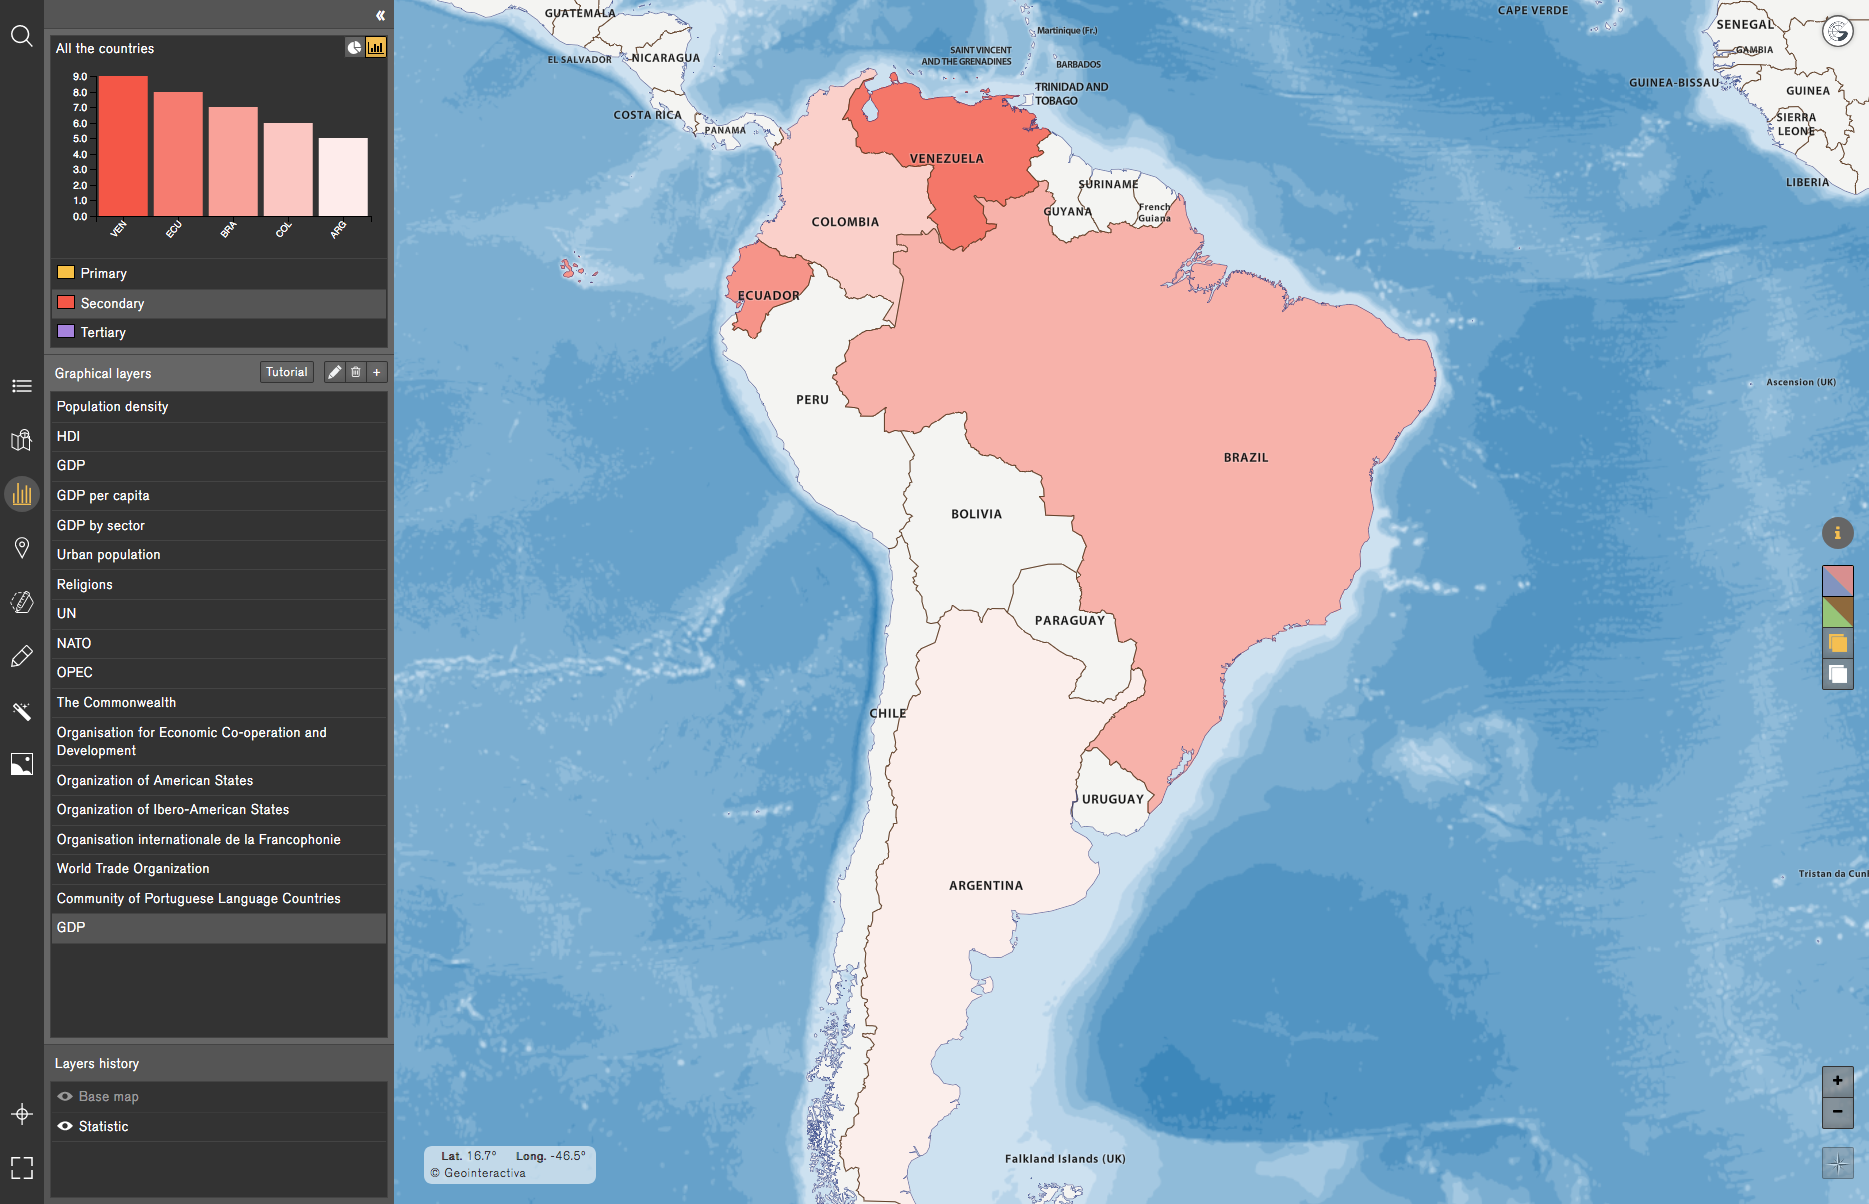
Geointeractiva provides a set of data tables and graphics layers that make up a basis on which users can deepen in aspects such as; the knowledge of human interaction with the territory it occupies, make comparisons, postulated hypothesis of the study etc.These databases, together with those that the user can upload, allow the final adoption of informed criteria against the reality that exposes the human geography.
The Statistics tool allows the user to create tables of quantitative data (statistical maps) and qualitative (thematic maps). When we create a new data table, first of all, we must select the type of variable/s and name it/s, then select the regions that we want to integrate, and finally assign values to each of the regions for each variable that we have created. Once this process has been done, we have, then, successfully created a data table.
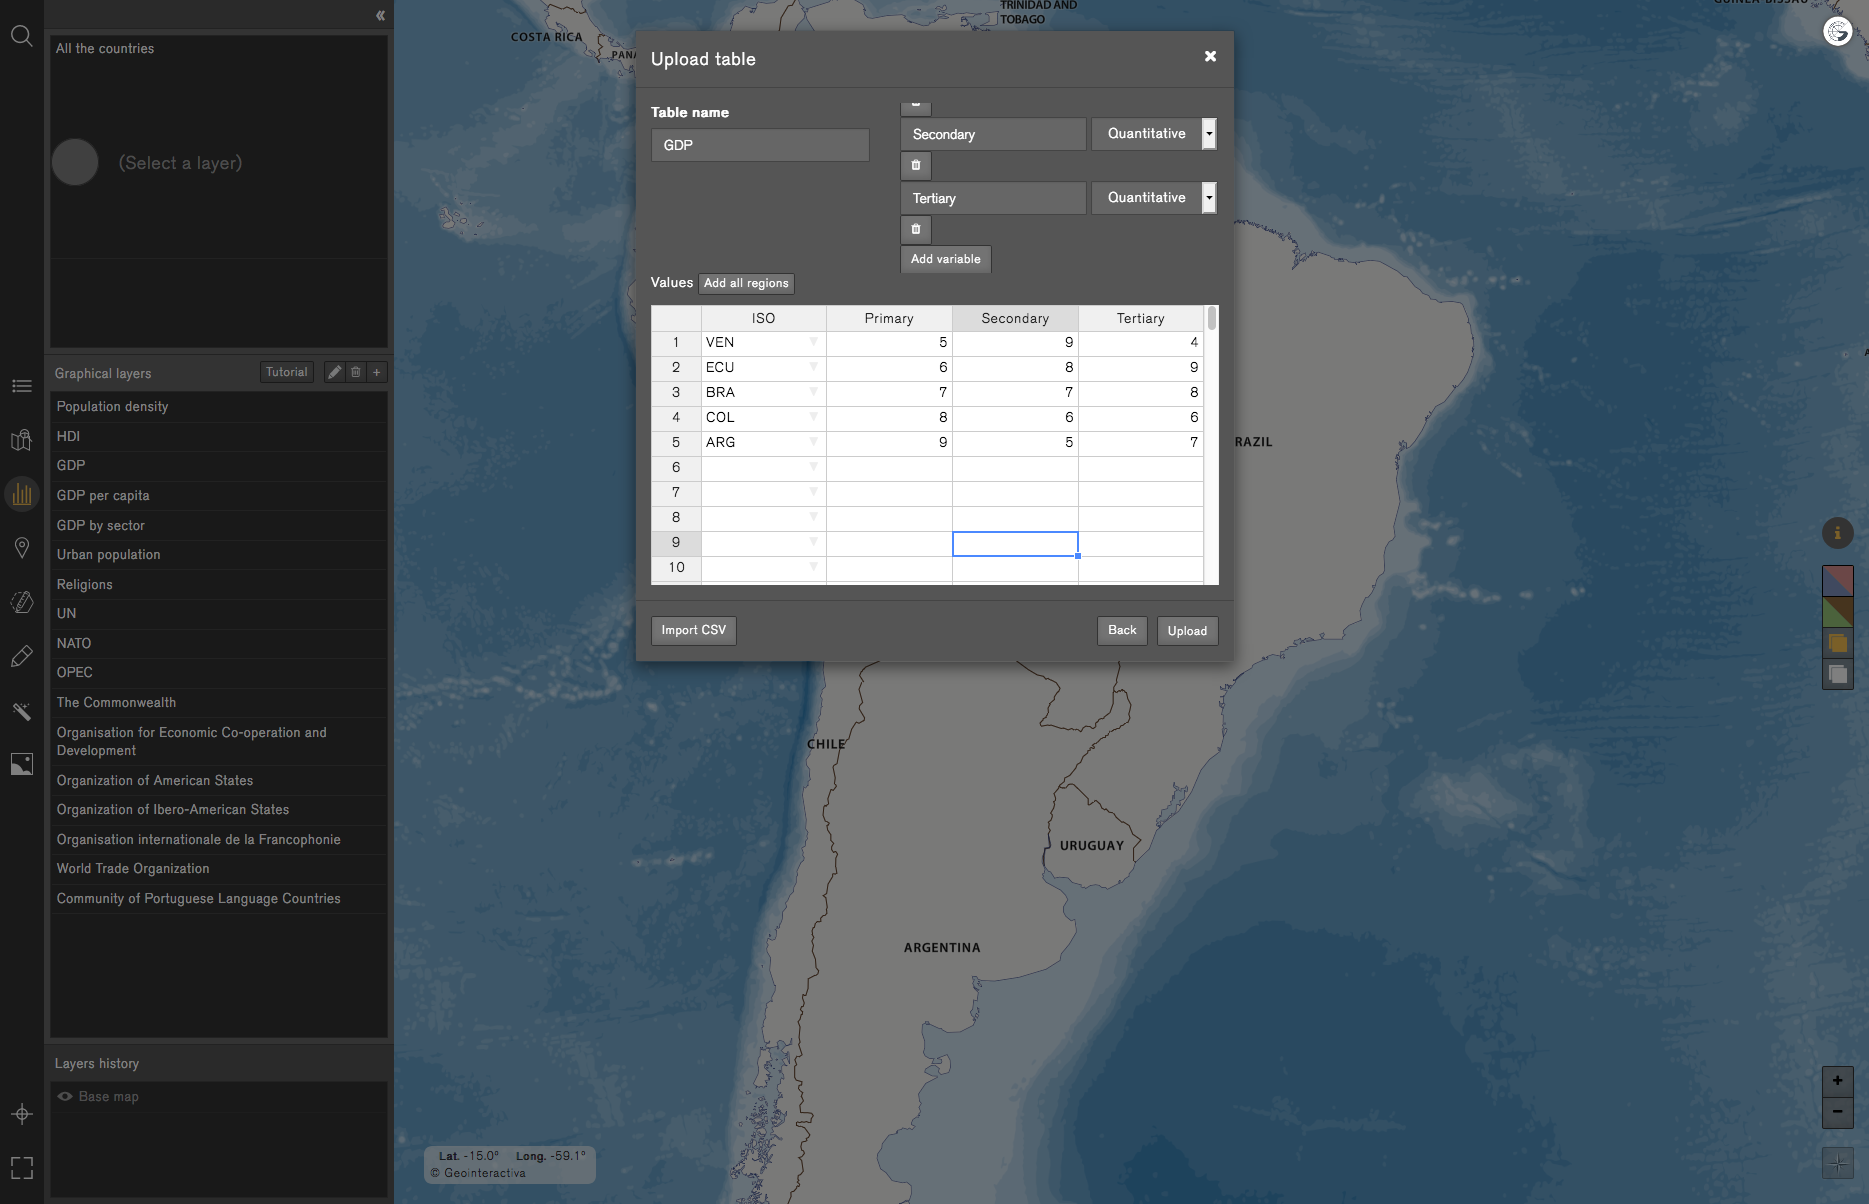
From a data table we can create graphic layers. That is why a single table of data can be used to create several graphical layers, since each one of them can, for example, contain different variables.
Activities with a printed Atlas
Activity 1Checking the distances between populations in the Geointeractiva app with the help of the scale on the Atlas map.
Example: Checking the distance between San Ignacio and Belize City
Step 1. The scale of the Belize map in the Atlas is 1:735000, which means that a unit of measurement on the map corresponds 735000 units in the territory.
Step 2. If we measure with a rule the distance between San Ignacio and Belize City, we will then check that the measure is 13.7 cm.
Step 3. Applying a rule of three; we multiply 13,7cm. times 73,5000 and divide it by 1. The result is 10,069,500 cm., which transformed into kilometers is 100 Km.
Step 4. Activate the Measurement & Magnitude tool within the Tool menu, click on San Ignacio and a double click on Belize City: The result is that between these two populations there is a distance of 100km.
In the Measurement & Magnitude tool menu we can change the unit of measurement (miles to kilometers). The Measurement & Magnitude tool menu also shows that the equivalent distance in Miles is 62.
Activity 2Introduce in the app the approximate coordinates of a population found in the Atlas.
Ejemplo: Finding the coordinates of Placencia in the app
Step 1. We look for the population of Placencia in the Atlas, where we will note that it is a little to the east of the meridian 88º 30'. In the field Long. of the application we will write the equivalent value of 88º 20', which is the length that seems to us to be more forthcoming, dividing the minutes between 60 and adding the degrees. We therefore obtain the value of -88.33, that is the decimal value of that coordinate, written in negative (-88.33) since it is the West longitude.
Step 2. We now see that Placencia is almost in the parallel 16º 30'. In the campò Lat. The app we will write the equivalent value of 16º 32', such as latitude that we believe more forthcoming, dividing the minutes between 60 and adding the degrees. We therefore obtain the value of 1653 that we will write in positive since it is in the north latitude.
Step 3. We can now use the Search tool in the upper left corner of the app and write the values of latitude (1653) and length (-88.33) of Placencia and a red circle we will mark its geographical location. Remember that the South latitude and the West longitude are negative.